Lean Manufacturing and Plant Design using 3D simulation with Data Analytics
VB Engineering is a pioneer in providing solutions for process improvement with the help
of lean tools. We have been offering various 3D simulation services with data analytics
and artificial intelligence for Production Improvement using process simulation and
virtual reality. Our offerings have enabled our clients towards Continuous Improvement
and made them ready for just in time manufacturing. Production improvement is always a
challenge including multiple parameters and various fields. The interdependency of the
production environment is highly complex and the only responsible person will be the
production person for the delay.
What is lean manufacturing? &
How do I adopt lean methodology is the burning question for every enthusiast in
manufacturing technology
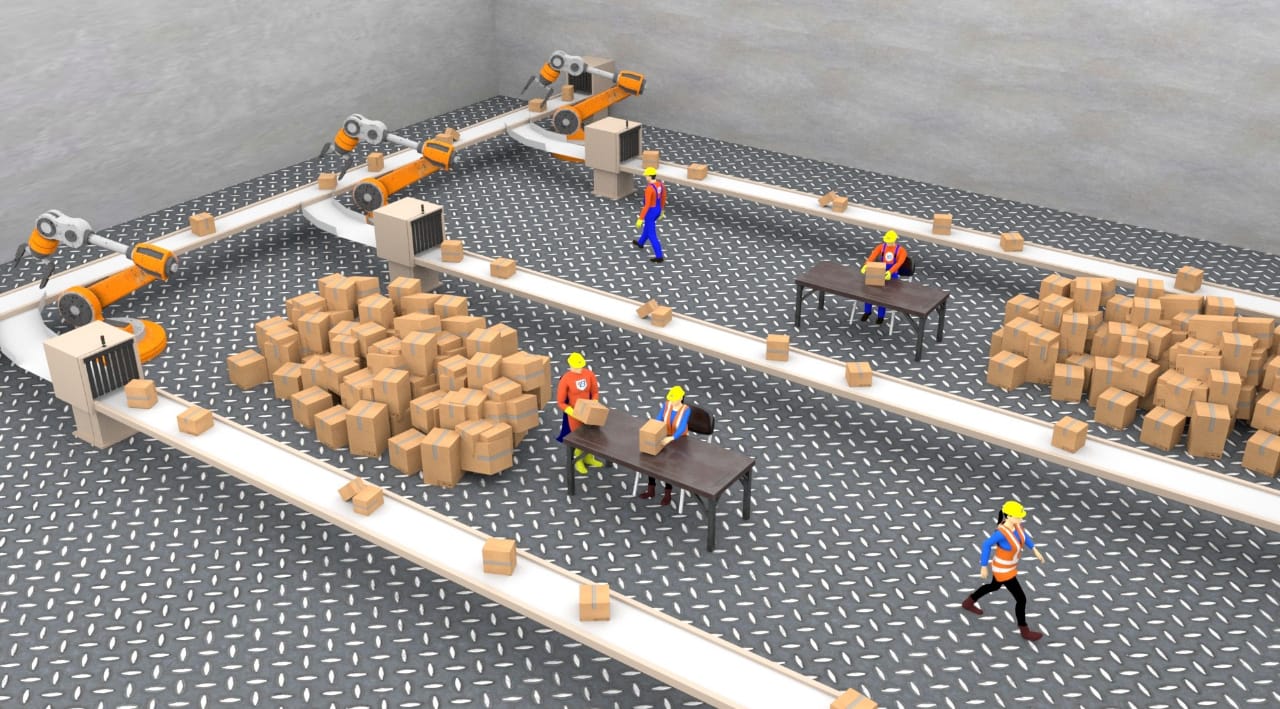
Lean manufacturing has been a best practice across the globe in manufacturing process.
Lean production systems and lean manufacturing principles are adopted by all the world
class manufacturing companies. Canning and bottling lines are extremely complex and
difficult processes to manage, as they consistently run at very high speeds, where a
minor stoppage can have a big impact on performance and costs to the business. The
difficulty in creating an optimal packaging line design that would maximize production
and efficiency is greatly amplified when there are many different packaging formats
together with frequent changeovers. With packaging lines costing crores of rupees, an
increasingly competitive market for contract packaging and demand for multi-variety
packs, there is a clear need to maximize return by ensuring the equipment is being fully
utilized to maximize return. Therefore, when designing packaging lines, it is necessary
to have some means of predicting and explaining their performance and identifying the
influence of the key line parameters such as, SKU complexity, machine capacities and
their acceleration, running speed and deceleration parameters, conveyor speed and their
lengths, failure rates in MTBF and repair rates in MTTR.
The Filler Machine is the Slowest Machine
The filling machine is the most important machine, as it performs the primary function of
the packaging line which is putting the product into the container. It is also in most
instances the slowest machine in the production line. Therefore, on most packaging lines
the filling machine is called the core machine and the rest of the line is designed
around it. Usually the line efficiency is based on the capacity of the filling machine
and other equipment is sized to ensure, as far as possible, that the filler does not
stop, because of failures on the other equipment. This is done for both efficiency and
quality reasons.
Design Principle and Buffer Strategy
We being partner of Manufacturing process simulation software like Flexsim 3d Simulation
has been helping the world with best simulation modelling software techniques and data
analytics. Especially for food manufacturing dynamic simulation software are very
helpful for building the manufacturing simulation environment. The design principle for
packaging lines amounts to a buffer strategy, which makes sure that the buffers before
the core machine are almost full and the buffers after the core machine are partly
empty. This allows the core machine to continue in the case of a failure somewhere else
on the line. In other words, the core machine should have products at the in-feed and
space at the discharge. So when designing a high speed packaging lines a few variables
that influence the design are very important. They are a well-defined Buffer strategy,
Production speeds, SKUs and changeovers times, MTBF and MTTR and Line efficiency.
Buffer Strategy
This buffer strategy consists of two complementary elements. The first element is formed
by the buffers which provide accumulation. Static accumulation is achieved by putting a
real buffer between machines (e.g. an accumulation table or a crate store). Dynamic
accumulation is accomplished by the conveyors between the machines.
Production Speeds
The second element is formed by production speeds of the machines. The machines on either
side of the core machine have extra capacity or overcapacity. This overcapacity ensures
that the core machine has products at the in-feed and space at the discharge. This
enables these machines to catch up after a failure has occurred. After a machine has had
a failure and (a part of) the accumulation is used, then the overcapacity of the machine
is used to restore the system back to the situation before the failure. The machine
before and after the core machine have extra capacity with respect to the core machine.
The machines upstream of the core machine each have extra capacity with respect to the
next machine, and the machines downstream of the core machine each have extra capacity
with respect to the previous machine. This results in the 'V' -shaped capacity graph for
the line stages, with the filling machine at the lowest point. The above figure shows
the machine capacity graph (or V-graph) of a typical bottle filling line.
SKU Complexity
The third element is that today's food and beverage companies often use many different
product families or formats, with each product family having a set of specific processes
unique to it. SKUs are made up from unique combinations of products (varieties/flavors
or qualities), primary packaging formats and secondary packaging formats. For example,
in primary packaging, cans and bottles can be different sizes, different shapes and may
require widget insertion. Likewise, bottles may require caps or crowns; new glass lines
and returnable glass lines frequently merge so common equipment can be shared. Secondary
packaging may involve, for example, hi-cones, shrink-wrapping, a wrap-around format, or
even more than one of these options. To provide flexibility, it is possible to flow
products out of several primary packaging modules into several secondary packaging
modules. Optimizing the performance of a packaging facility becomes increasing
challenging as combinations increase and the number of SKUs multiply.
Efficiency
The efficiency of a packaging line is the percentage of the actual production versus the
possible production, for a given period of time. This is the number of filled bottles or
cans versus the possible number of filled bottles or cans in a specified time period. It
can also be defined as the percentage of the time that is theoretically needed to
produce the actual output (=net production time) versus the actual production time.
Line Efficiency
The line efficiency is a measure of the efficiency of the packaging line during the
period specified, and is calculated as follows:
Line Efficiency = [ (net production time) divided by (net production time + internal
unplanned downtime) ] x 100
The break up of all the times involved is shown in the diagram below.
Therefore, the time variables for estimating Line efficiency are 'Net Production Time'
and 'Internal Unplanned downtime'. And it is these two time variables used to determine
Line efficiency.
If the filler is the core machine, then the filler determines the line.efficiency.
Therefore, in the efficiency analysis of packaging lines the focus is on the loss of
production time of the filler or the core machine. Note that loss of production on the
core machine cannot be recovered, so the production time of the core machine determines
the (maximum) output of the line. To therefore increase the line efficiency that
considers all the above mentioned complex variables and conditions is not easy. It
therefore becomes necessary to study the whole packaging line in a 3D visual simulation
model, where all these variables and their impact on line efficiency can be examined to
bring out the following benefits. Increased throughput and efficiency by understanding
where the opportunities for optimizing machine speeds and in defining an optimum buffer
strategy. Provides a way to put a packaging system to the test in a risk-free
environment, uncovering bottlenecks and starvation in the system and revealing any
equipment that is not being fully utilized. Uncertainty and risk associated with major
business decisions involving complex processes is mitigated. Validate capital
investments that performance goals are realized at the minimum cost. Each machine can be
in one of six states·:
1. Running
A machine is running when it is producing, this can be different speeds and with
different reject rates.
2. Planned down
A machine has a planned stoppage as in the case the machine is stopped for planned
maintenance, changeovers, not in use, etc.
3. Machine internal failure
A machine has an internal failure when the machine stop is caused by a machine inherent
failure. There are often many different failure causes depending on the complexity of
the machine.
4. Machine external failure
A machine has an external failure when the machine stop is caused by external factors,
either caused by another part of the organisation (e.g. no supply of empties, no beer,
no electricity, etc.), or by the operator(s) of the line (e.g. lack of material such as
labels, cartons, glue, etc.) and waiting time.
5. Starved
A machine is starved (or idle) when the machine stop is due to a lack of cans/bottles or
cases. The machine has no input, i.e. the conveyor preceding the machine is empty,
because of a reason upstream on the line. Note that some machines can be starved for
more than one reasons, e.g. a packer can be starved for bottles and for boxes.
6. Blocked
A machine is blocked when the machine stop is due to a backup of cans/bottles or cases.
The machine has no room for output, i.e. the conveyor succeeding the machine is full,
because of a reason downstream on the line. Note that some machines can be blocked for
more than one reason, e.g. a de-palletiser can be blocked by pallets and by crates.
Hence, a machine is either running, or a machine is not running for anyone of above five
reasons. A simulation model will therefore predict the amount of time spent in each of
the above states and thus enable the designer to find ways to increase line efficiency.
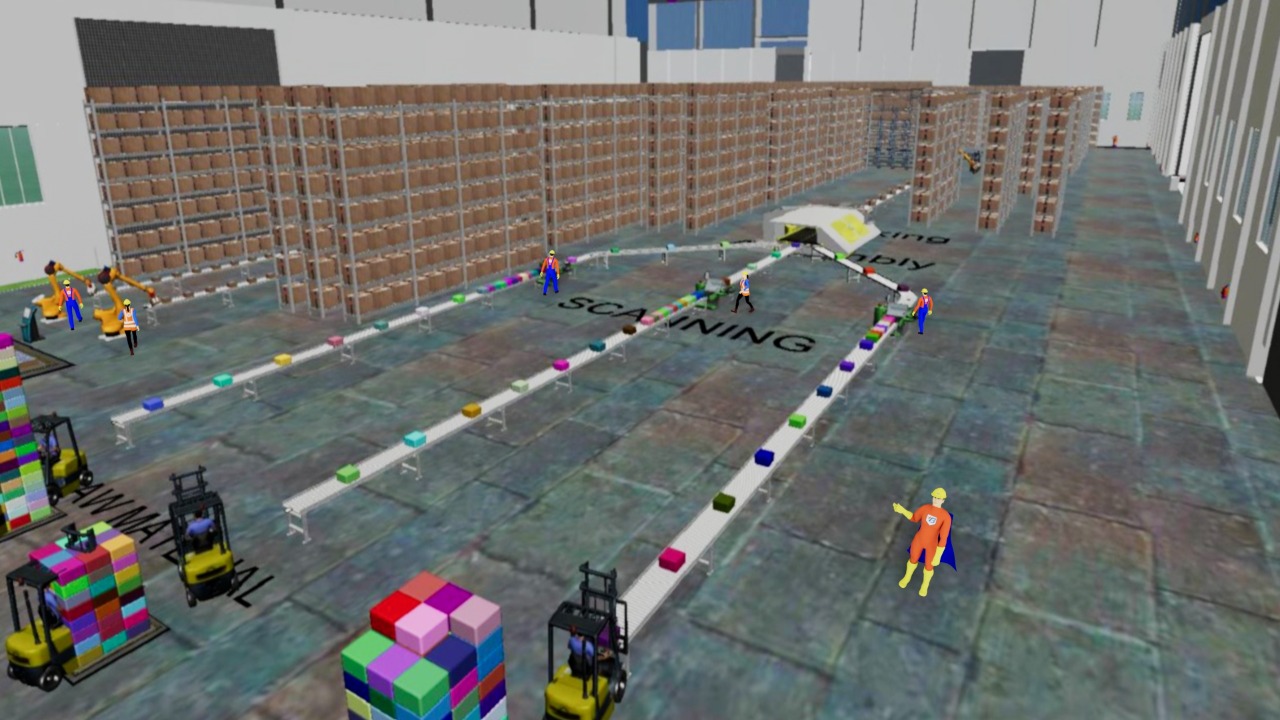
Simulation Model of Packaging Line
Simulation modelling is ideally suited for its unique time-based approach, in conjunction
with the ability to reflect the factors that vary, enable simulation models to
accurately mimic the complexities of a real-life packaging system. The objectives here
being to design the line to maximize the usage of critical equipment and maximize the
absorption of minor stops. Faster, more efficient packaging lines are able to respond
more quickly to market demands and lower raw material and finished goods inventory.
Companies need to take a hard look at the kind of tools used to analyse their core
business operations, especially involving large complex packaging lines. A decision
based on incorrect results can cost several crores of rupees or even hundreds of crores
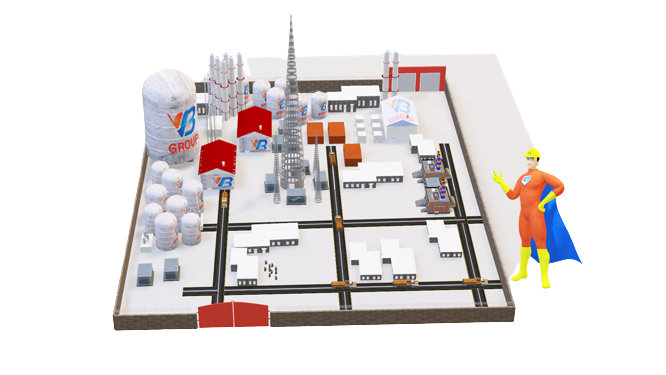
of rupees, if we are dealing with large operations. The 3D design models built were
ensured to be lean six sigma compliant and the integrations of Logistics simulation has
taken the overall business game to the next level. The art of "Simulate today to see How
is tomorrow" has been mastered by VB Engineering with help of Artificial Intelligence
manufacturing software simulation techniques.