Will the new warehouse hold the pallets and clear the peak day, and how many dock doors, pickers, sorter chutes and robots does it need? Proven in a simulation before the racking, the building or the automation is ordered.
Racking, picking, sorter, dock, AMR and cold store models, delivered for plant warehouses, distribution centres and 3PLs in India and available worldwide through integrators and design consultants. Layout and capacity simulation, not warehouse management software and not controller emulation.
Trusted by the World’s Most Demanding Plants.





























































What is a warehouse layout and capacity simulation?
A warehouse layout and capacity simulation is a computer model of the distribution centre that receives, puts away, picks, sorts and ships every order of the peak day, pallet by pallet and tote by tote, and reports the positions in use, the lines per hour, the trucks waiting for a door and the equipment the building needs. The model is a discrete event simulation (it advances one event at a time: a pallet lands on a dock, a picker reaches a slot, a parcel drops into a chute), built in FlexSim from your SKU master, your order history and rates measured on your floor. It sizes the layout and the capacity; it is not warehouse management or control software, and it is not an emulation of a vendor's controller.
Warehouses come to VB with one of three questions. A new DC or an extension is on the capex list and the pallet positions, dock doors and pickers in the layout have to hold the forecast before the racking is ordered. An automation proposal (an ASRS, a sorter, an AMR fleet) carries a vendor's throughput figure and the board wants it proven on the company's own order profile before the purchase order. Or a running DC is missing the dispatch cut-off every peak, with the racking, the pickers, the sorter and the dock each blamed in turn. The same model answers all three with the same figures: positions in use on the peak day, lines and parcels per hour, truck turnaround, equipment and people per shift, and the output of every option on the table.
Warehouse capacity terms, in plain words
| Term | What it means | What the model does with it |
|---|---|---|
| Pallet positions | Rack locations that can hold one pallet, counted after aisle width, beam levels and honeycombing (part-empty locations) are allowed for | Counted from the drawing, then loaded with the forecast stock day by day; the peak-day occupancy, not the drawing count, is the capacity |
| Slotting | Which SKU sits in which location; fast movers (A-class) nearest the pick face and the dock | Re-slotting is tested as a scenario before a metre of racking is added, because it usually buys more throughput than racking does |
| Lines per hour | Order lines picked per picker per hour, with the travel, the search and the confirmation inside it | Built from the order profile and the travel distance the layout produces; the figure a labour plan and a WMS go-live are judged by |
| Dispatch wave | The block of orders released together to meet a carrier cut-off | The wave sets the peak on the sorter, the packing benches and the outbound doors; the model runs every wave of the peak day |
| Dock turnaround | Minutes from gate in to gate out for a truck, including the wait in the yard for a door | Built from arrival pattern, door count, dock rule and unloading rate; answers how many doors the building needs |
| Recirculation | Parcels that pass their chute because it is full or they were not read, and go round the sorter again | The figure that separates a sorter's catalogue rate from its real rate; reported per wave |
| Scenario | One set of changes (a re-slot, a VNA aisle, two chutes, six robots, a dock rule, a forecast case), replayed over the whole peak day or peak week | One scenario per option in the report, each carrying its own capacity, service level and cost |
| Validation | Replaying a week the DC already recorded and setting the model beside the WMS and dock logs | Comes before the first option; the fit is printed in the report |
Want the positions and the lines per hour your layout really gives, not the formula? The one-page peak-day check comes back from the SKU master and last peak month's order lines.
How many pallet positions, dock doors and pickers does a new warehouse need?
The number the peak day produces, not the number the formula produces: the formula (square metres divided by a positions-per-square-metre norm, or doors per 10,000 square feet, or lines a day divided by a lines-per-picker rate) gives the budget figure for the capex paper, and the simulation then runs the real SKU mix, the real order profile and the real truck arrivals through the drawing and reports the day the building actually fills, the hour the yard backs up and the wave the pickers miss. The same method sizes the sorter, the AMR fleet and the cold store doors.
| Process | What the static formula gives | What the simulation adds |
|---|---|---|
| Racking and positions | Floor area times a positions-per-square-metre norm for the rack type, less an allowance for honeycombing | Peak-day occupancy from the forecast stock profile, the honeycombing the SKU mix really produces, the day the building fills, the re-slot that buys a year |
| Picking | Lines a day divided by a lines-per-picker rate from the last labour plan | Travel per line from the layout and the slotting, congestion in the pick aisles, lines per hour by wave, the pickers per shift the peak day needs |
| Conveyor and sorter | Sorter catalogue rate times working hours | Induction rate, chute full and recirculation, merge queues, the wave that overruns the cut-off, the chute count against a second sorter |
| Dock doors and yard | One door per 5,000 to 10,000 square feet, or trucks a day divided by turns per door | Door occupancy against the real arrival pattern, yard queue by 15 minutes, dock booking rule against a new door, inbound and outbound split by hour |
| AGV and AMR fleet | Totes an hour divided by totes per robot per hour from the vendor's sheet | Aisle traffic and blocking, charging rule, totes waiting at the pick stations, the fleet that holds the wave against the fleet the quotation carries |
| Cold store | Pallet positions in the chamber and doors by the loading rate | Door-open time against the loading wave, airlock and dock dwell, pallets held on the dock above temperature, the door rule against a third door |
The formula gets the capex paper past its first review. Only the simulation shows the Tuesday in the festival peak when two inbound containers land on the hour the dispatch wave is released and the yard backs up to the gate, and that one day is what the operations head, the 3PL contract and the automation vendor's guarantee will be judged on.
Get the positions, doors, pickers, chutes and robots for your own forecast, judged against the cut-off your clients hold you to.
Which parts of a warehouse does VB simulate?
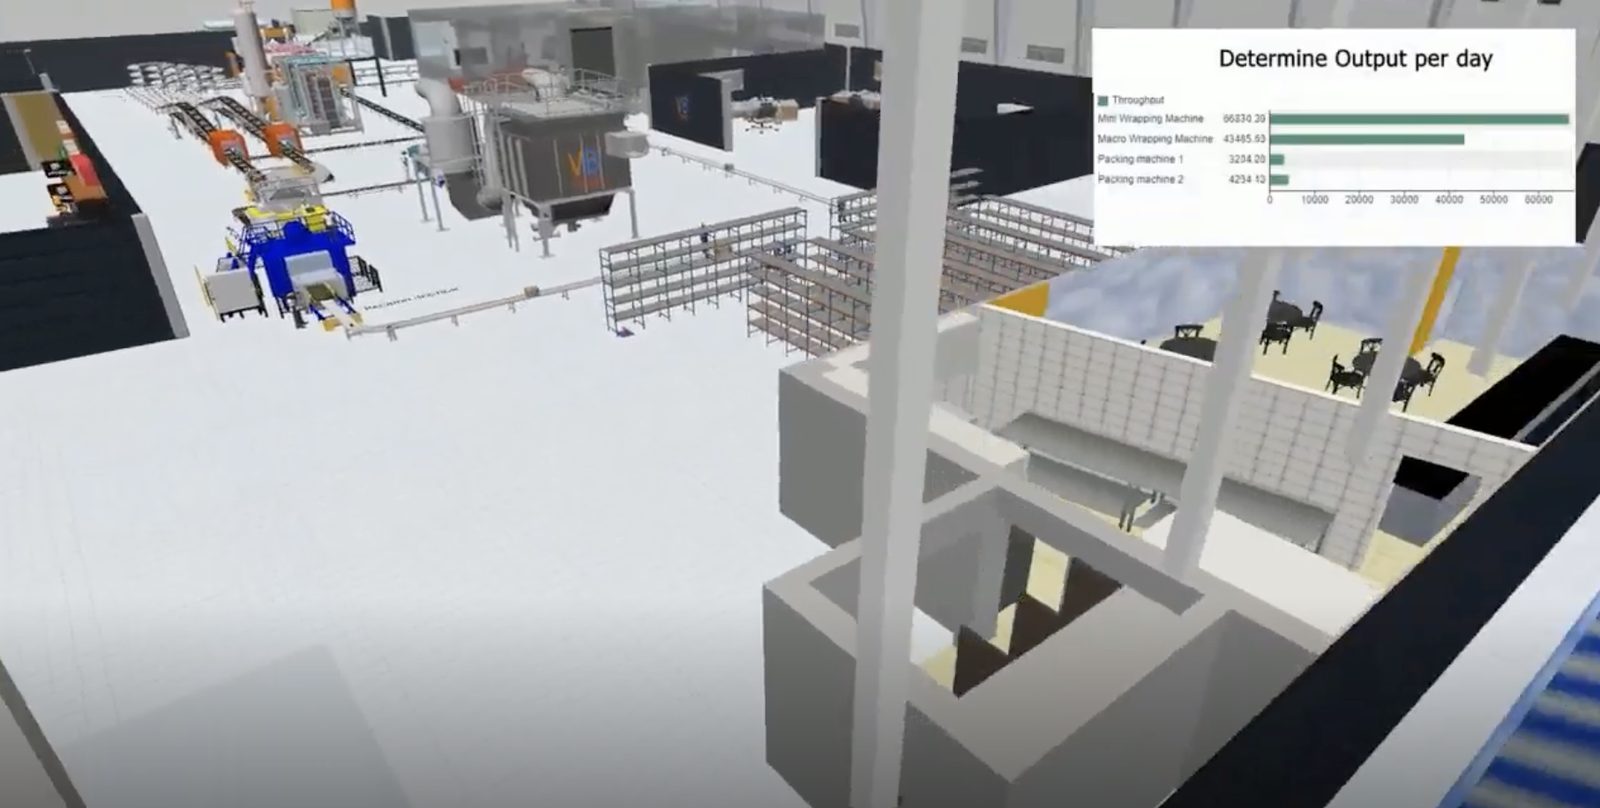
Racking and slotting, picking, conveyor and sorter, dock doors and yard, AGV and AMR fleets, and cold stores: the six process areas a distribution centre is sized by, each modelled as a queue system and then linked into one building, so a slotting change in the racks is felt at the sorter and a late truck is felt in the pick wave. The six panels are illustrative runs; the figures for your warehouse come from your order profile and SKU master.
Behind each panel is one discrete event simulation: a model that moves every pallet, tote, parcel, truck and robot through the day an event at a time, built in FlexSim on the order profile and the SKU master, fed with pick, putaway and dock rates timed on your floor, and scored on lines per hour, positions in use, truck turnaround and the peak day instead of catalogue rates.
Model one process area or all six in a single building model; the choice follows the decision.
What does a warehouse simulation look like when it runs?
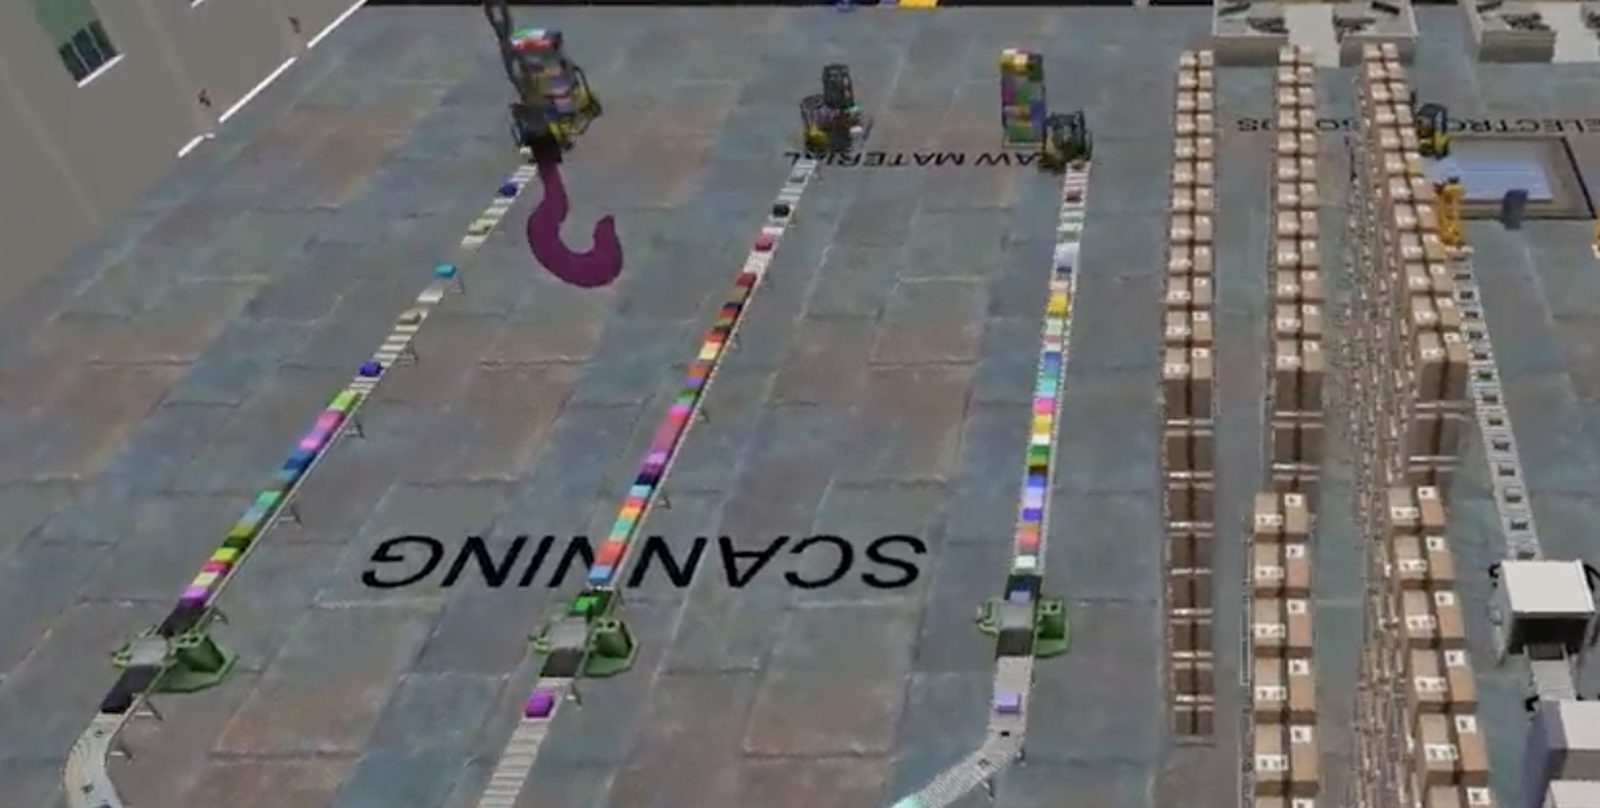
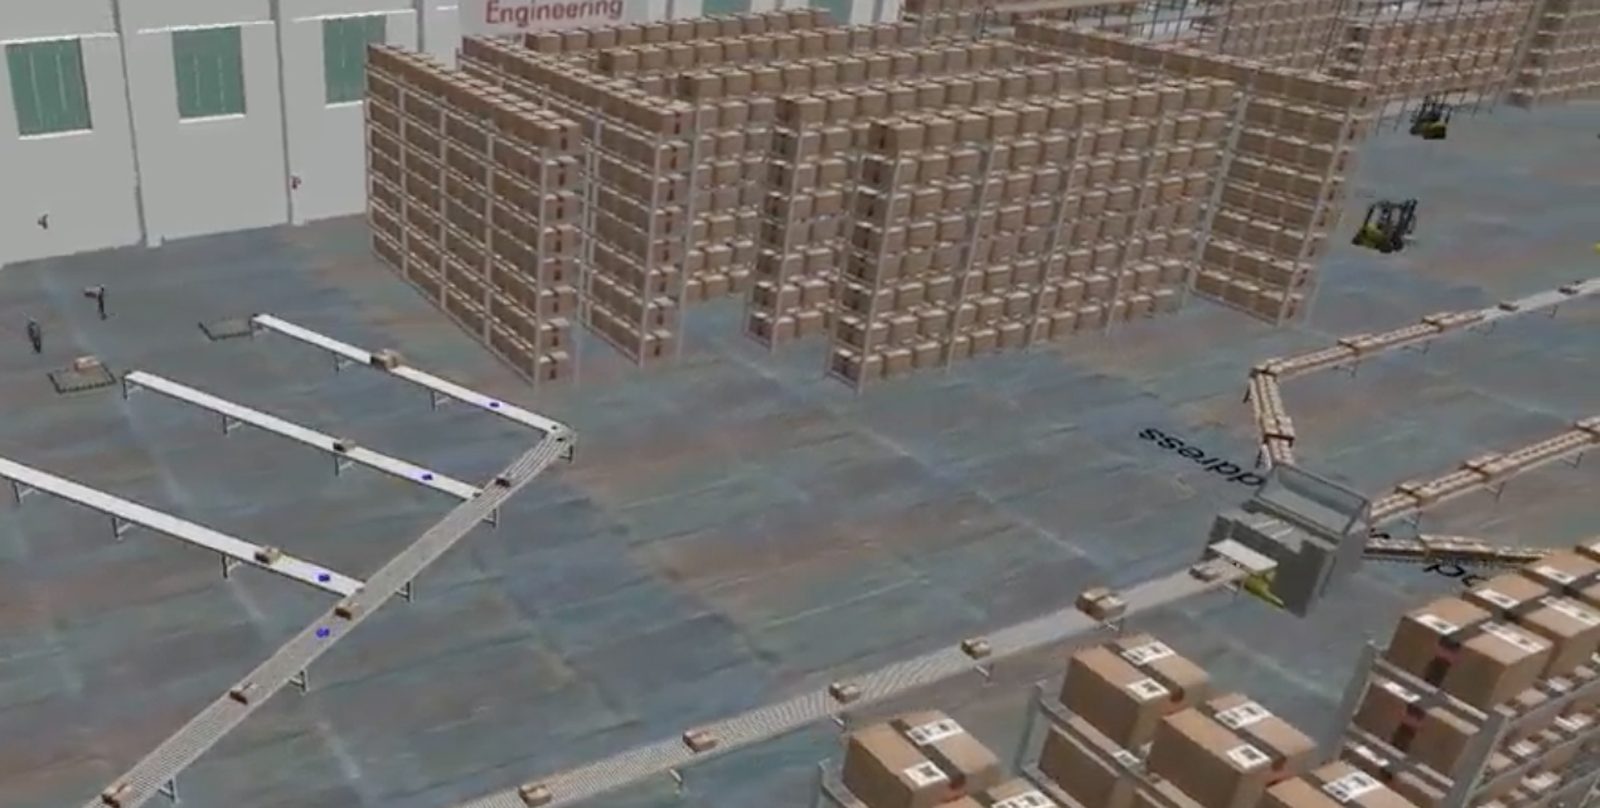
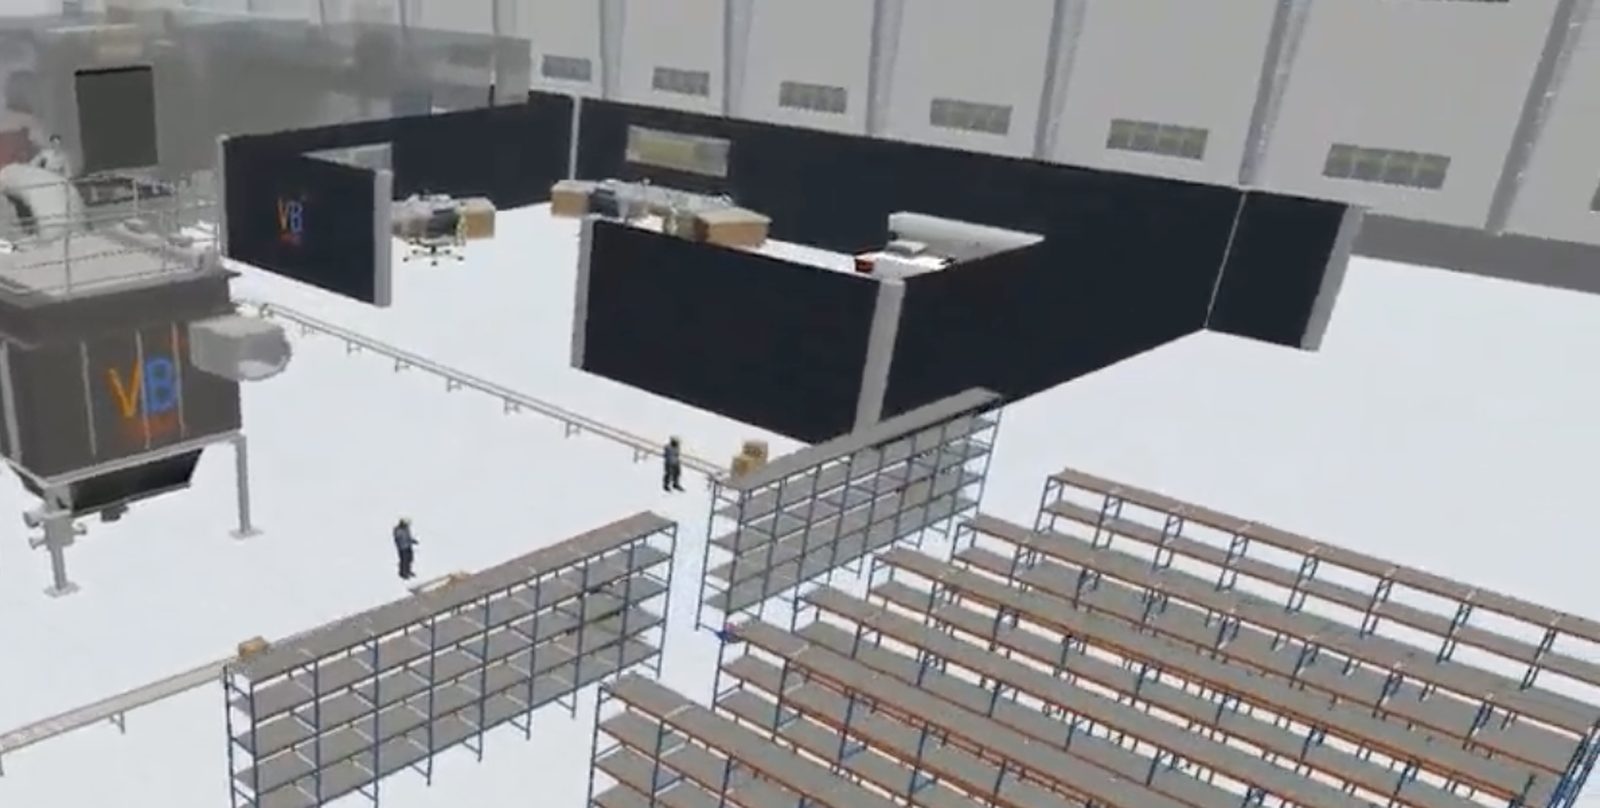
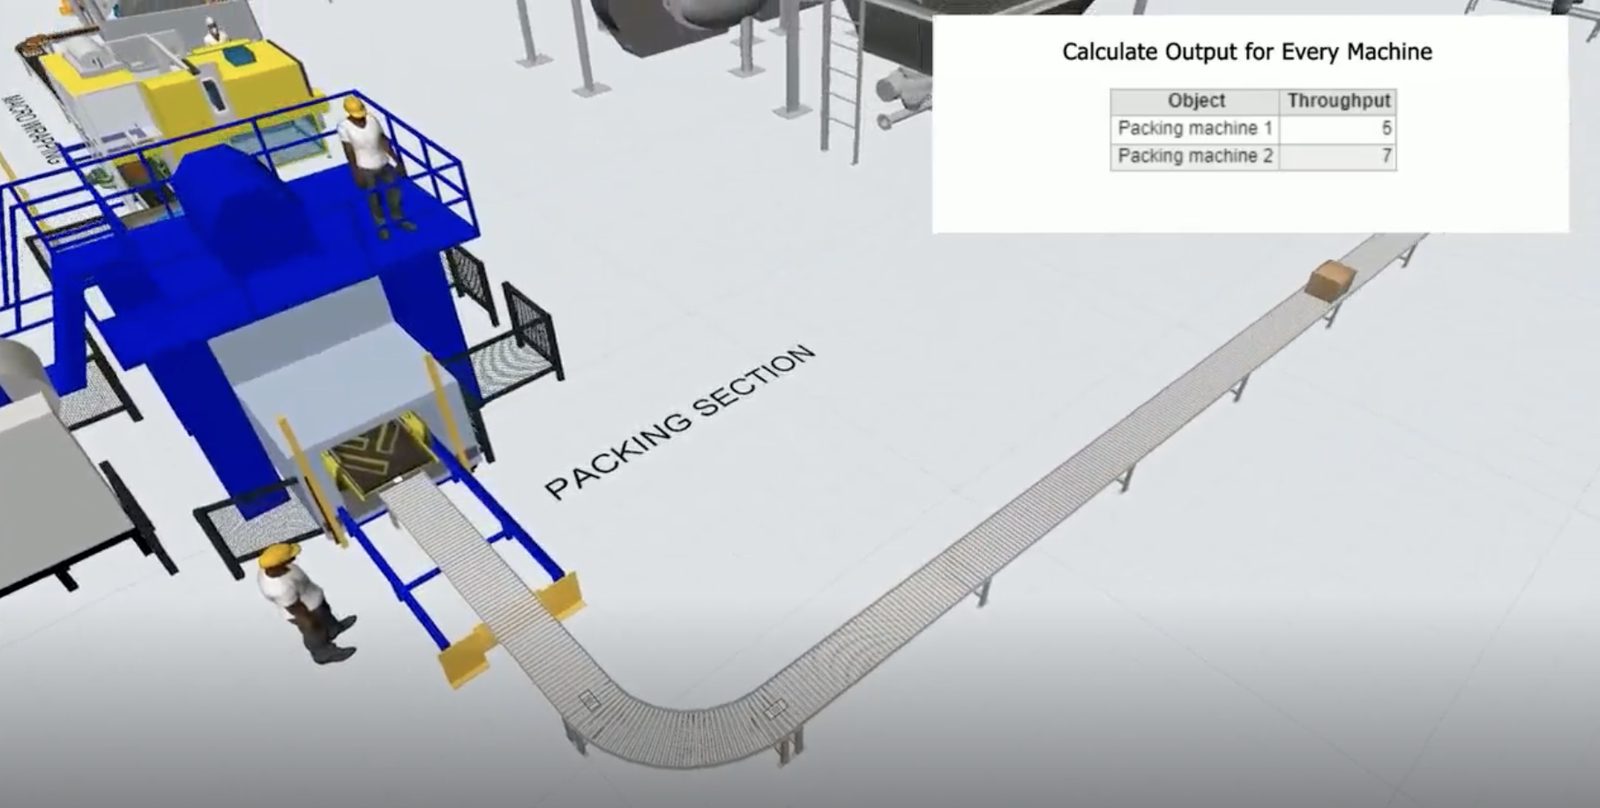
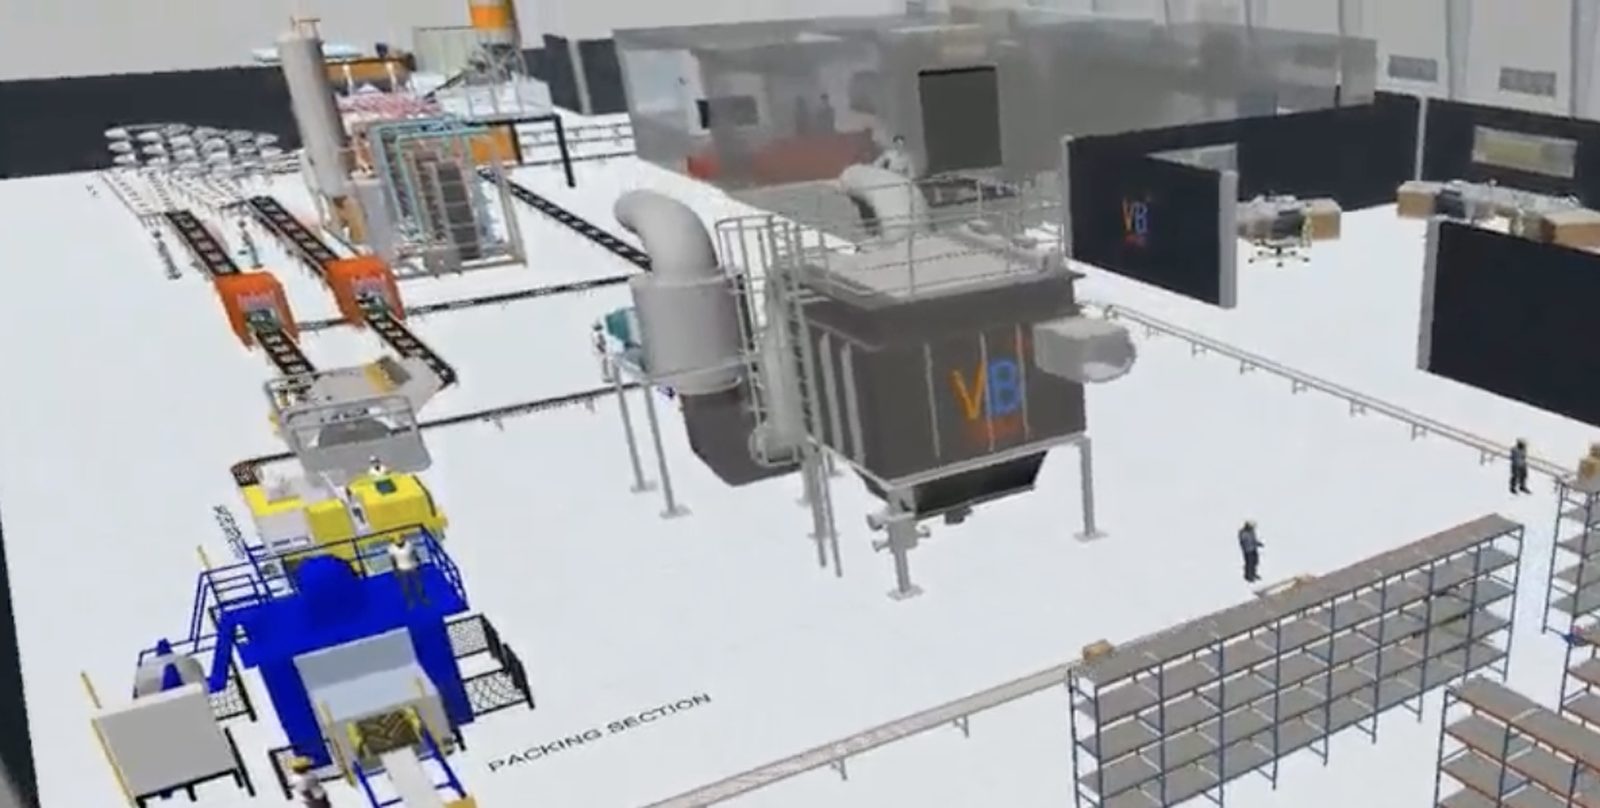
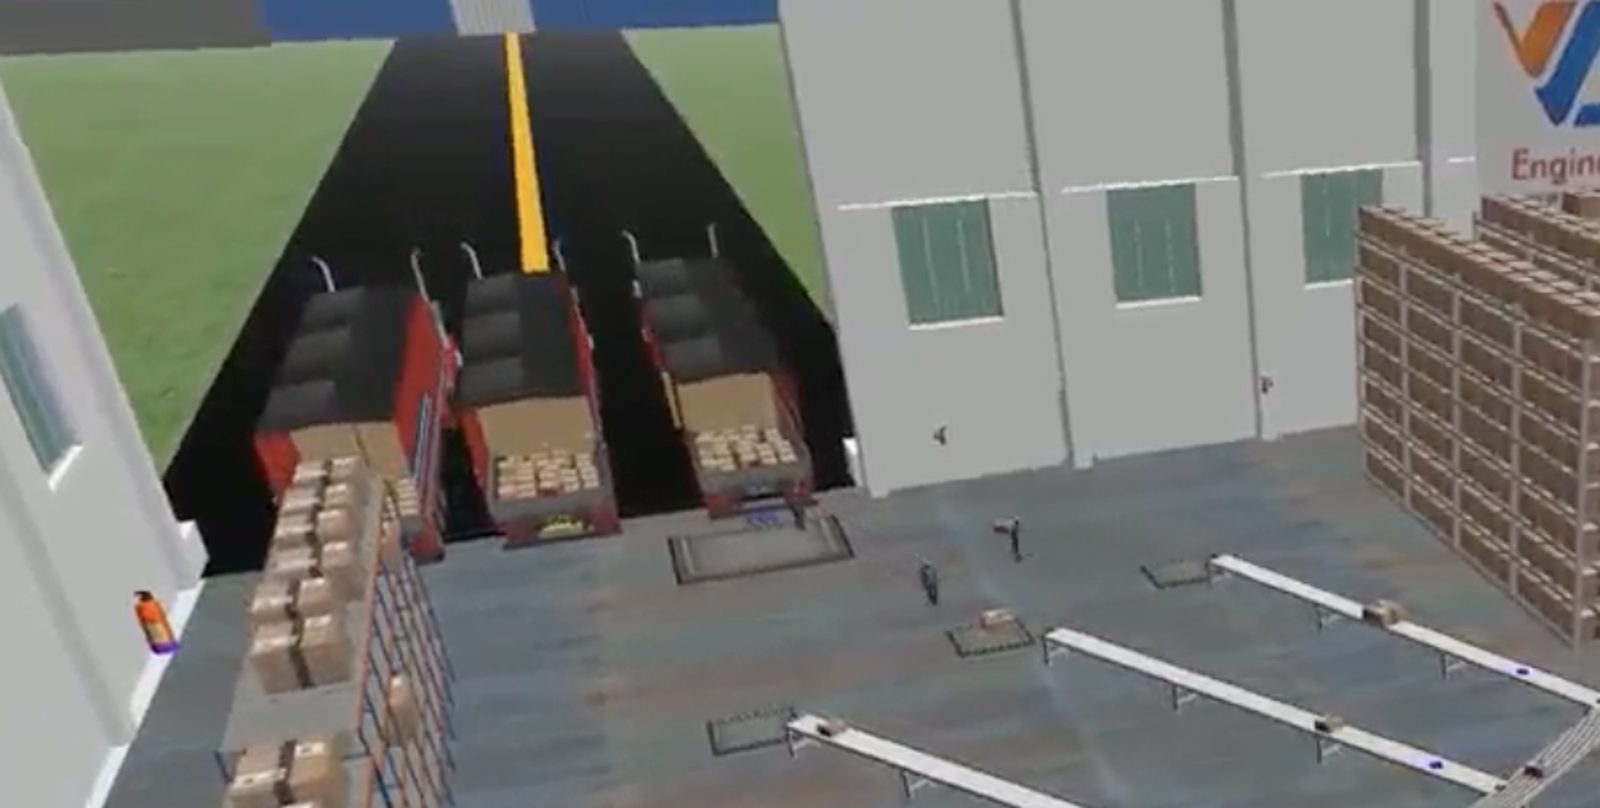
The 3 minute 16 second run below is VB's own cargo handling and warehouse model: goods received, scanned, barcoded, packed, racked and dispatched, with the input and output counted on every conveyor and the throughput and content charts building as the run proceeds. A distribution centre's racking, pick zones, sorter and docks are modelled the same way; this is a representative run, not a client's building.
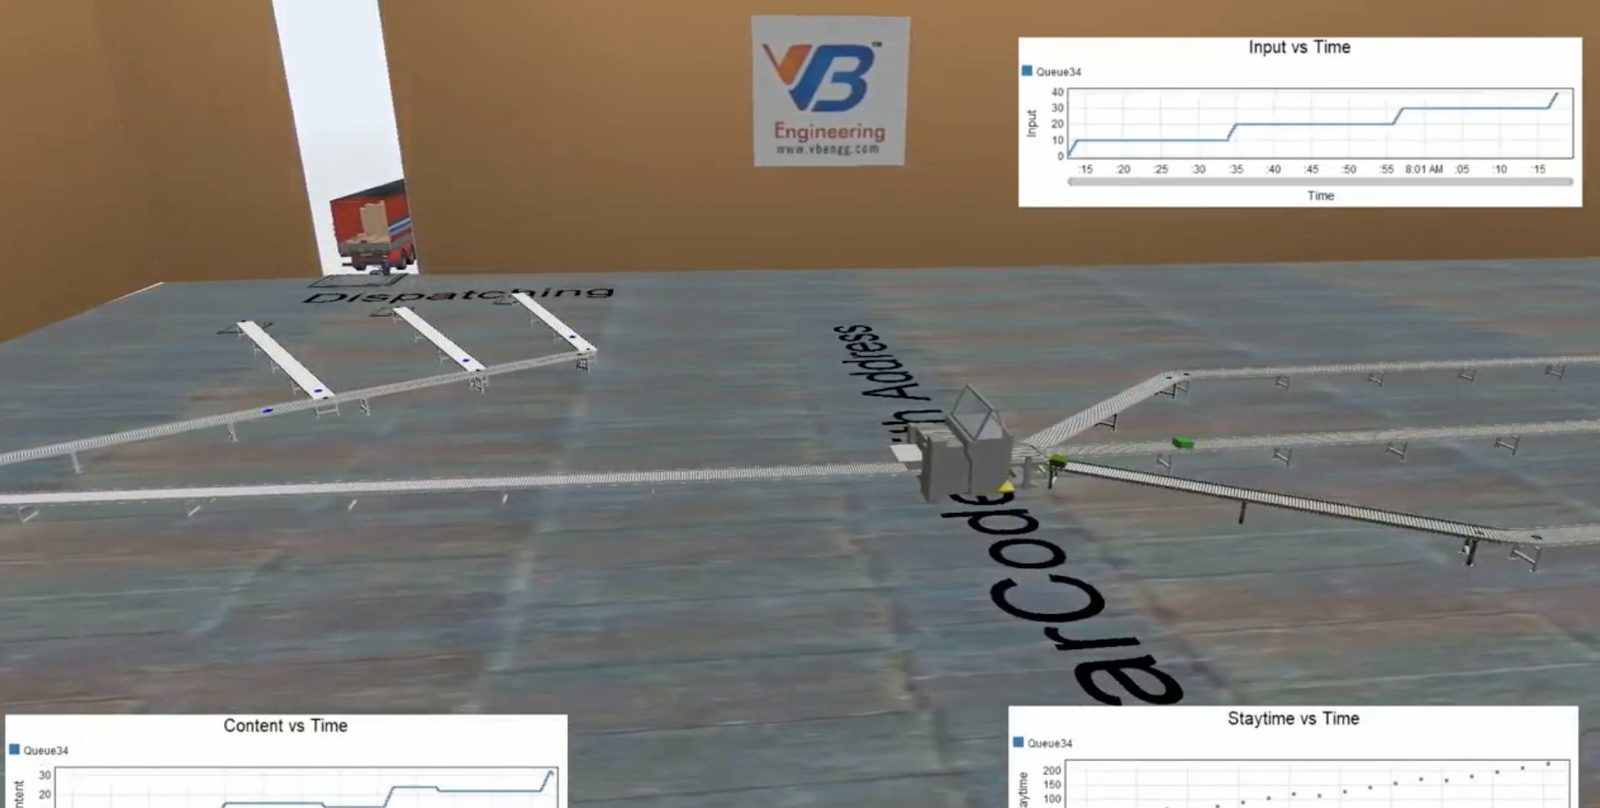
From the VB Group YouTube channel: 3D simulation of a cargo handling system. Nothing loads from YouTube and no cookie is set until you press play.
Want this run on your own DC, with your SKU master and your order history? The one-page peak-day check comes first.
When does a warehouse or distribution centre need a simulation study?
A warehouse buys the study when a number is about to be relied on by someone outside operations: the positions, doors and people in a new-DC capex paper, the throughput figure in an automation vendor's guarantee, the capacity a 3PL has contracted to a client, or the fix for a DC that misses its dispatch cut-off every peak while the racking, the pickers, the sorter and the dock are blamed in turn.
New DC, automation purchase, full racks or a missed peak: price the study for your situation.
How does a warehouse simulation compare the layout and automation options?
Every option is run on the same peak week, the same SKU master and the same order profile, so the options compare on five like-for-like figures: pallet positions in use on the peak day, lines or parcels per hour at the peak wave, truck turnaround, the equipment and people the option needs, and cost. The table below is a six-block distribution centre facing an expansion decision, modelled as an illustration; your table is built from your own WMS history.
| Scenario | Positions at peak | Peak wave, lines per hour | Dock turnaround | What it costs |
|---|---|---|---|---|
| Today · 8,400 positions, 14 pickers, 12 doors | 96% | 2,900 · 18% of orders late | 71 min | Nothing; the peak cut-off is missed every season and the 3PL penalty keeps coming |
| Option A · A-class re-slot, zone pick rule, dock booking rule | 88% | 3,600 · 0 late | 14 min | A slotting exercise, two rules and WMS configuration; no racking, no civil works |
| Option B · Option A plus one VNA aisle and two sorter chutes | 78% | 3,600 · 0 late | 14 min | One aisle of VNA racking, one truck, two chutes; inside the current building |
| Option C · a 40 per cent extension with a second sorter | 61% | 3,900 · 0 late | 12 min | Building, racking, sorter and 6 more doors; needed only when the forecast passes Option B, in year four on the base case |
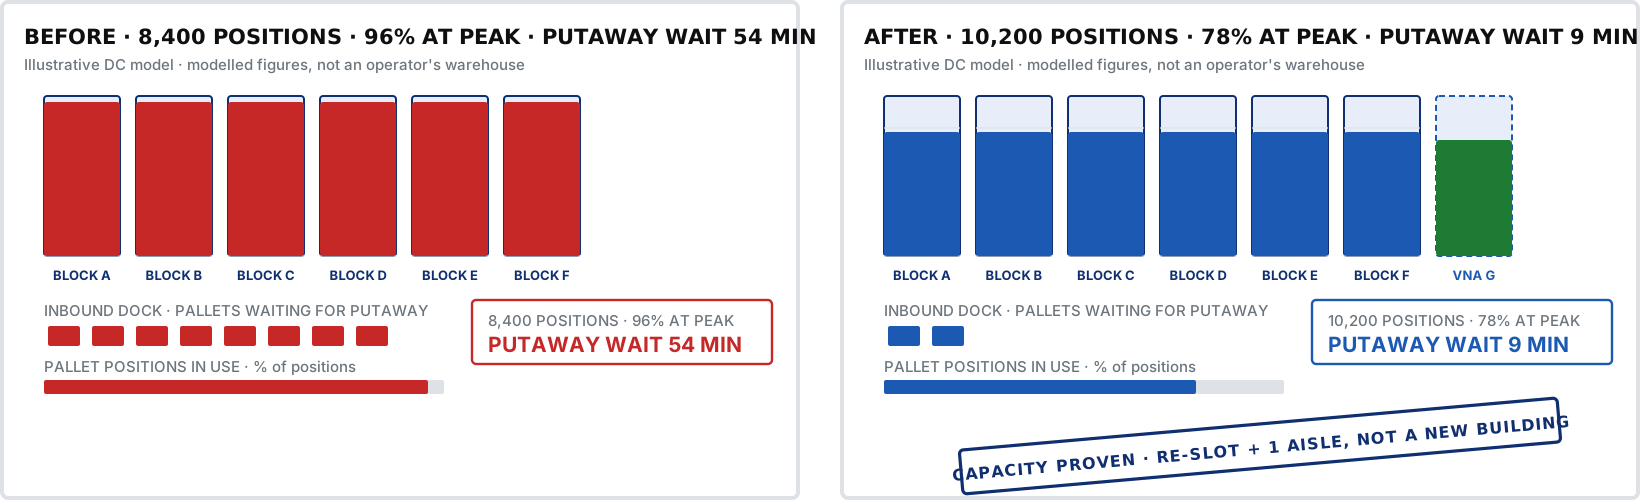
That table is where the extension moves from this year's capex to year four, and where the operations head gets the slotting and dock rules that clear the next peak without a purchase order. The CFO, the 3PL client and the automation vendor each read it before anything else.
Get the option table for your own DC: positions, throughput, turnaround, equipment, people and cost per option.
Which standards and norms govern a warehouse layout and capacity study?
No statute requires a warehouse simulation, and every norm that governs the building shapes what the model may propose: the racking standard sets the aisle widths and beam levels the position count is allowed to assume, the fire code sets the flue spaces, aisle widths and storage heights, the dock and forklift safety rules set door spacing and traffic separation, and the 3PL contract or the WMS vendor's rules set the service levels the scenarios are scored against.
| Standard or norm | What it does to the options |
|---|---|
| Racking design standards: IS 875 loading, SEMA and FEM 10.2 rack codes, the rack manufacturer's load tables | Aisle widths by truck type, beam levels and bay loads, VNA tolerances. The position count in every scenario is drawn inside these limits; a position the rack code does not allow is not counted. |
| Fire and life safety: NBC 2016 Part 4 and local fire NOC conditions, NFPA 13 for sprinklered rack storage where the insurer requires it | Flue spaces, aisle widths, storage height against sprinkler design, in-rack sprinklers for high-piled stock. Every racking scenario is checked against the storage height and flue space the fire design allows before it is costed. |
| Dock, forklift and traffic safety: Factories Act rules on material handling and the site's own traffic plan | Door spacing, dock leveller and trailer stand, pedestrian and forklift separation, AMR and forklift zones. Dock and fleet scenarios obey the traffic plan; a shortcut across a pedestrian route is not an option. |
| 3PL contract, WMS and automation vendor terms | Contracted throughput and cut-off times, the vendor's performance guarantee and its assumptions, the WMS wave and slotting rules. All of these go into the model as inputs, every option is scored against them, and the vendor's guarantee is tested on your order profile rather than theirs. |
Page one of every VB warehouse report names the rack code, the fire design height and the order profile behind the sizing, so an insurer, a 3PL client or a lender can check the basis without reading further.
What does a warehouse layout and capacity simulation include?
The DC is modelled as it operates now or as the drawings propose it, the model is proven against a week the WMS already recorded, and the study closes with an option table and a report from which the board, the operations head, the 3PL client and the automation vendor each take the page they need.
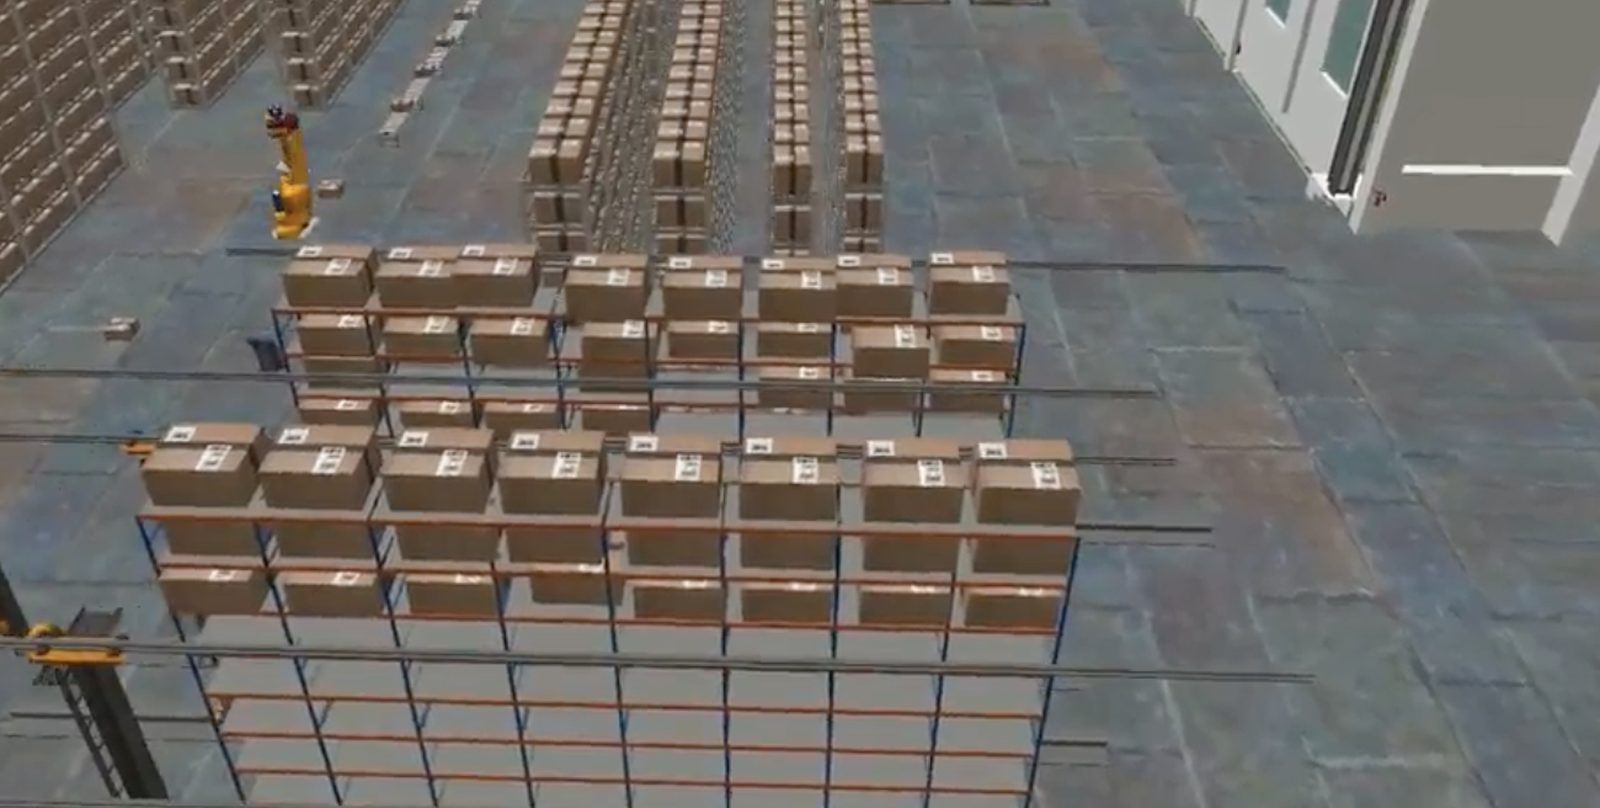
- Data pack: SKU master with dimensions and velocity, 12 months of order lines, inbound receipts and truck arrivals, stock profile by day, pick, putaway, packing and unloading rates measured on the floor, WMS wave and slotting rules, the layout drawing
- Whole-building model in FlexSim: racking and slotting, pick zones, conveyor and sorter, packing, dock doors and yard, AGV or AMR fleet, cold store, or any one process area alone
- Validation on a recorded week, the fit against the WMS and dock logs printed before the first option is run
- Three to five scenarios replayed over the full peak week, each reported on positions in use, lines and parcels per hour, dock turnaround, equipment and people per shift, and cost
- Option table and recommendation, with the racking plan, the slotting rule, the dock schedule and the fleet or chute count that go with it
- The layout and capacity report for the capex paper, the 3PL bid, the board or the automation tender, the model file, and a walkthrough session with your team
Send the SKU master and last peak month's order lines: the one-page peak-day check comes back with the positions the formula says, the positions and the lines per hour the order profile actually produces, and the gap.
How is a warehouse simulation study priced?
Three variables move the price: how many process areas are modelled, whether the SKU master, order history and rates can be exported from your WMS or must be timed on the floor, and how many scenarios and forecast cases the decision needs. At the small end is a single process area on clean data; at the large end, racking, sorter, fleet and docks in one building model, or an automation tender scheduled back from its submission date.
| Part of the work | How it is priced | What moves the price |
|---|---|---|
| One process area (racking and slotting, picking, sorter, docks, AMR fleet or cold store) | Pallet positions or lines a day and the counts in play | Scenarios, whether the data is measured or supplied, report for a capex paper or a board note |
| Whole DC, dock to dock | Building size plus floor days | Process areas to measure, shifts to observe, 3PL clients and carriers to interview, forecast cases |
| Network of DCs, automation tender or 3PL bid | Buildings, systems and fleets in one model | Phases and forecast cases, vendor options to test, submission or go-live deadline |
Get a price estimate
Three questions about your warehouse, read by a simulation engineer against the DC studies VB has delivered, answered with an estimate.
This work is not quoted by a calculator; a simulation engineer reads your three answers. Prefer proof before a price? Ask for the one-page peak-day check of your busiest process and it arrives ahead of the estimate.
How does VB build a warehouse simulation model?
Four stages, each with a deliverable of its own: the data pack assembled from WMS history and the layout drawing, with floor measurement where the logs fall short; the model proven on a recorded week; every option replayed over the full peak week; and the report walked through with operations, the planner and the 3PL client or the vendor ahead of the board.
Data pack
SKU master, order lines, receipts, truck arrivals, stock profile and WMS rules pulled from your systems; pick, putaway, packing, sorter and unloading rates timed on the floor over the peak shifts.Model and validate
Racking, pick zones, sorter, docks, fleet and cold store built in FlexSim, then a week the DC already recorded is replayed and the model's positions, lines per hour and turnaround are set beside the WMS and dock logs. No option is run until that fit is reported.Scenarios
Between three and five options, each replayed over the whole peak week: slotting and wave rules, a VNA aisle, chutes, robots, doors, a dock rule, forecast cases. One table carries positions, throughput, turnaround, equipment, people and cost for all of them.Report and walkthrough
The layout and capacity report written for the capex paper, the tender, the 3PL bid or the board, the model file, and a walkthrough in which operations, the planner and the vendor each take ownership of their figures before sign-off.The static formula sizes a warehouse for an average day; the peak day is the one that costs money. Capacity fails on a specific day: two inbound containers land on the hour the dispatch wave releases, the A-class pick aisle is blocked by a putaway truck and the racks are already at 94 per cent. That day is built into the model from your own WMS history and timed rates, the model is proven on a week the DC has already been through, and only then are the racking, pickers, sorter and doors sized.
Seven weeks from data pack to walkthrough. Book the floor-measurement fortnight before the next peak starts.
Which software does VB use for warehouse simulation?
The racking, picking, sorter, dock, fleet and cold store models are built in FlexSim (the discrete event simulation platform Autodesk now owns), and the model file is part of the handover, so your own planners can run the next peak's scenarios without VB. Racking plans and dock layouts are drawn in AutoCAD on the building plan, slotting is worked in your WMS export, and the rack and fire limits follow the SEMA and FEM rack codes and NFPA 13 where the insurer calls for it. Where an integrator or a client standard names AnyLogic or Simio instead, VB's simulation team works in those.
| Stage | Tools we work in | What you receive |
|---|---|---|
| Data pack | Your WMS export (SKU master, order lines, stock profile), dock and gate logs · stopwatch and count on the floor at the pick face, the packing bench, the sorter and the dock across the peak shifts | A single data pack listing every input and where it came from, signed by operations and planning |
| Model and validate | FlexSim racking, pick zone, sorter, dock, fleet and cold store model · validation run against a recorded week | The model file, the validation fit and the register of assumptions |
| Scenarios | FlexSim experimenter, three to five options replayed over the peak week | Option table: positions, throughput, turnaround, equipment, people, cost |
| Layout where needed | AutoCAD on the building plan | Racking plan, slotting map, dock face and fleet zone layout in DWG and PDF |
| Report and handover | Layout and capacity report, FlexSim model file, scenario dashboards, 3D run video, walkthrough session | A capex annex, a tender or board paper, and a model that stays with your planners |
Running a different platform? Tell us which one in the form. We deliver in the software and drawing standard your plant already uses.
Product names are trademarks of their respective owners.
What does a warehouse simulation study deliver, start to finish?
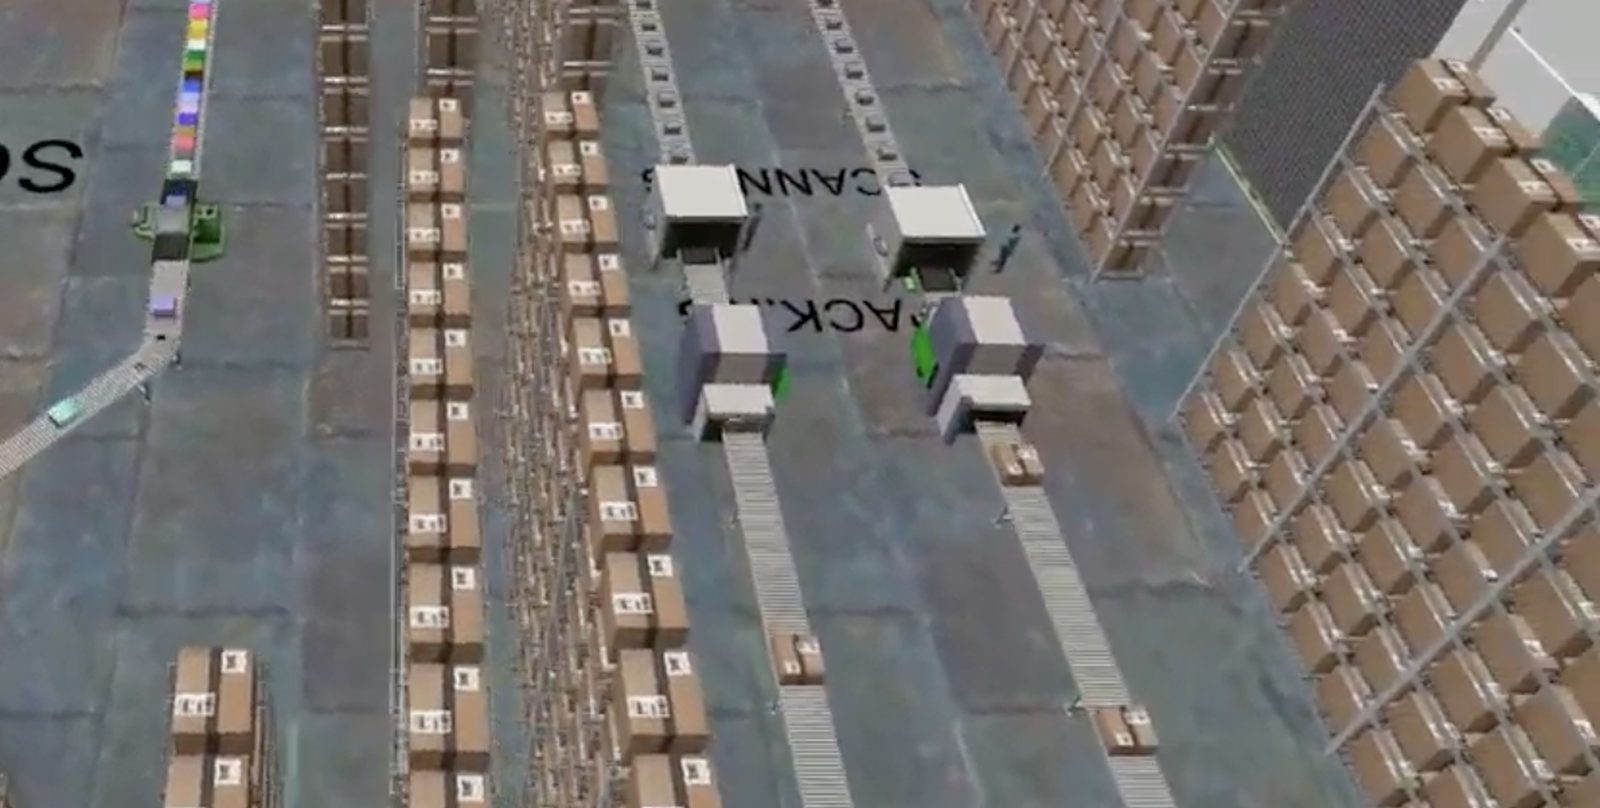
A large 3PL distribution centre in India asked for its racking, pick zones and docks to be modelled with an extension on the capex list and a client contract pressing on the peak cut-off. The brief: prove whether the extension was needed this year, in year four or not at all, and give operations a slotting and dock rule it could run in the meantime.
The model loaded the forecast stock profile and ran the peak week through the DC as it stood and then with each option, reporting positions in use, lines per hour by wave and yard queue hour by hour rather than as a monthly average. The A-class re-slot and the dock booking rule were tested first, one VNA aisle and two chutes second, and the extension with its second sorter last, each against the same cut-off. The 3PL took away the option table with the year each option becomes necessary, the slotting and dock rules to run until then, and the model file. Neither the 3PL nor its client is named here, and the figures shown on this page are representative.
Proof before commitment: a one-page peak-day check of your busiest process.
Who builds, checks and signs your warehouse model?
Three named people, CVs attached to the proposal: a simulation engineer who builds and validates the model, a warehouse planning engineer who challenges every input against the order profile and the rack and fire norms, and an approver who signs the report.
Simulation lead
CV shared with the proposalWarehouse planning engineer
CV shared with the proposalVB Engineering approver
CV shared with the proposalWarehouse simulation: the questions plant heads, 3PLs and integrators ask
How many pallet positions will the new warehouse hold?
Fewer than the drawing count, by the honeycombing your SKU mix produces, and that is the first run after validation. The drawing gives positions from floor area, rack type and beam levels; the model loads the forecast stock day by day and reports the positions actually usable on the peak day and the day the building fills. In the illustration on this page a six-block DC drawn at 8,400 positions runs at 96 per cent on the peak day until a re-slot and one VNA aisle take it to 10,200 positions at 78 per cent.
How many dock doors does a warehouse need?
As many as the truck arrival pattern and the dock rule need at the turnaround the carriers accept, not the one-door-per-10,000-square-feet rule. The model runs the real arrivals, the inbound and outbound split and the unloading rate through the dock face and reports door occupancy by hour and the yard queue by 15 minutes. In the modelled example on this page a booking rule took 12 doors from a 71-minute to a 14-minute turnaround and no new door was needed.
How is warehouse capacity calculated, and why simulate it?
The static calculation is positions times a utilisation factor for storage, and lines a day divided by a lines-per-picker rate for throughput; both are averages. The simulation replaces the factors with your stock profile, your order waves and your truck arrivals, so the capacity figure is the one the peak day produces, and the report shows which process fails first and in which year.
Can simulation prove the automation ROI before the ASRS, sorter or AMR order?
Yes, and independently of the vendor. The model runs your own order profile and SKU mix through the proposed system with the vendor's rates as inputs, and reports throughput at the peak wave, the chute or fleet count that holds it, and the year the system is needed. In the modelled example two chutes and an induction rule replaced a second sorter, and 24 robots replaced a quotation for 32.
How many AMRs does a warehouse need?
The number that holds the pick wave with the aisle traffic, the charging rule and the totes waiting at the pick stations inside the target, which is not totes an hour divided by totes per robot. The model runs the fleet through the wave and reports blocking, waiting totes and station utilisation; in the modelled example 18 robots left 240 totes waiting, 24 with a traffic rule left 12.
Will the new DC handle the peak season throughput?
The model answers it as a day, not a percentage: the forecast peak week is run through the layout and the report names the day and the wave the cut-off is first missed, the process that misses it and the fix in order of cost. If the answer is yes, the report also says for how many years on the base forecast.
What data does a warehouse simulation need?
The SKU master with dimensions and velocity, 12 months of order lines, inbound receipts and truck arrivals, the stock profile by day, the WMS wave and slotting rules, the layout drawing, and pick, putaway, packing, sorter and unloading rates. Nearly all of it exports from the WMS and the dock log; whatever the logs do not carry is timed on the floor.
How long does a warehouse layout and capacity simulation take?
About seven weeks for a single DC when the WMS history is clean: two weeks of data pack and floor measurement, two of model building and validation, two of scenario runs, and the last week for the report and the walkthrough. One process area on its own takes less; a network study or an automation tender is scheduled back from the submission date, and the proposal states the programme for your building.
How much does a warehouse simulation study cost?
Three things set the price: how many process areas go into the model, whether the SKU master, order history and floor rates already exist or have to be measured, and how many scenarios and forecast cases the decision needs. One process area on clean WMS data sits at the bottom of the range; racking, sorter, fleet and docks in one building model sits at the top. VB publishes no rate card: the estimator on this page brings a written proposal by email.
What is the difference between warehouse simulation, WMS software and emulation?
Warehouse simulation answers a layout and capacity question: how many positions, doors, pickers, chutes and robots, at what service level, in which year. A WMS runs the warehouse day to day; emulation connects a live warehouse control system to a virtual building to test the controller's software before go-live, and it belongs to the integrator. VB delivers the capacity study and sizes the layout and the automation; it does not sell the WMS or the emulation, and it tests the vendor's throughput guarantee on your order profile.
Something this page has not answered? A simulation engineer replies within one working day.
Where to go next
Get a price estimate for your warehouse simulation study
Say what is being decided, which process areas are in scope, the pallet positions or lines a day, and when the number is due; a simulation engineer comes back with the estimate, the programme and a written proposal.
- The one-page peak-day check of your busiest process, for proof before you commit
- Your DC, as it runs or as it is drawn, modelled and checked against a recorded week
- The written proposal for the full study, with its estimate and programme
Prefer to write? connect@groupvb.com · or WhatsApp us from the chat button
VB Group® · Sustainability A Certainty.
Five fields. A written proposal back.
Name, work email, organisation, the decision in hand, the pallet positions or lines a day, and the date the number is due.