Pharma plant capacity planning that proves the output of a new line, an investor case or a running block before the money is spent
Line and plant models for pharma, API and packaging delivered in India, the Gulf and the USA since 2014, validated against the plant's own records before any option is run.
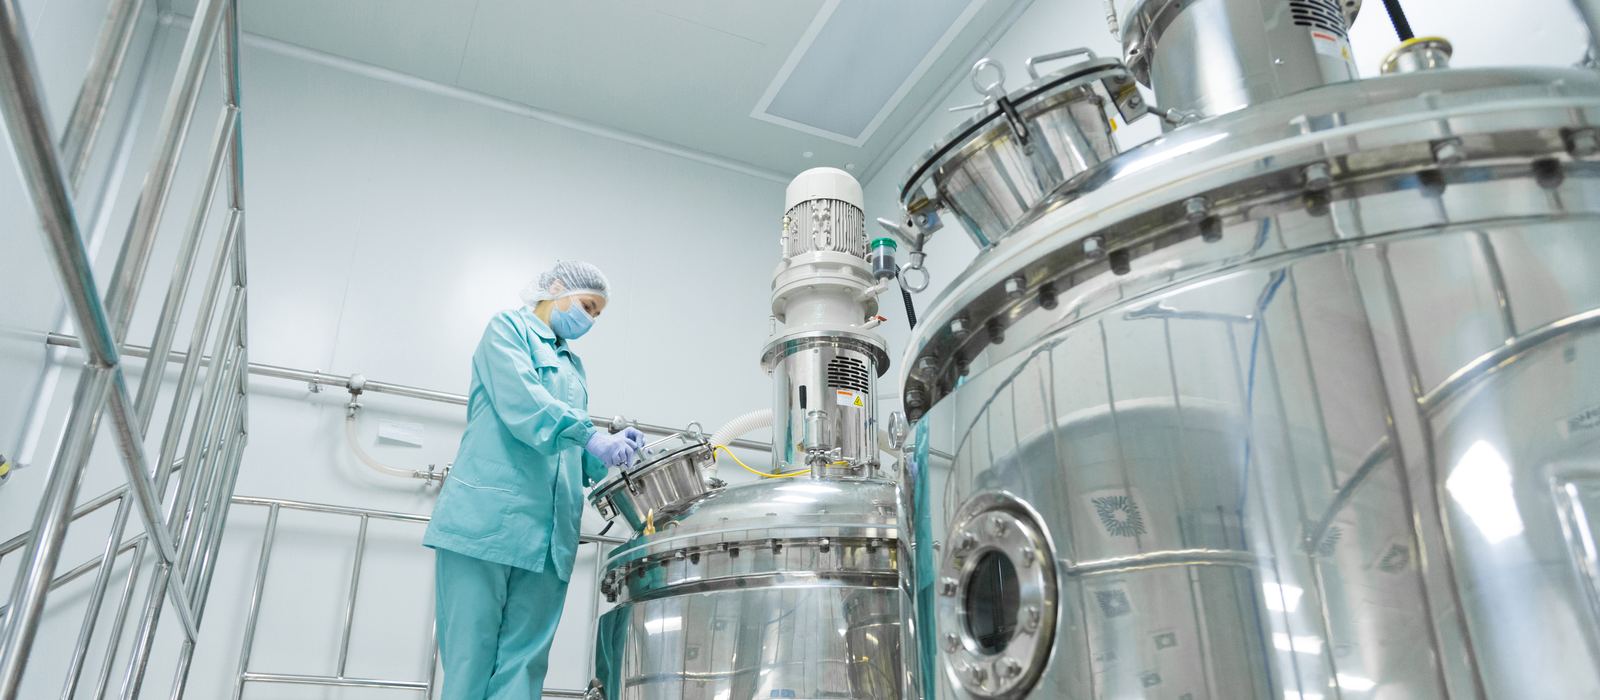
Trusted by the World’s Most Demanding Plants.































































What is a pharma plant capacity model?
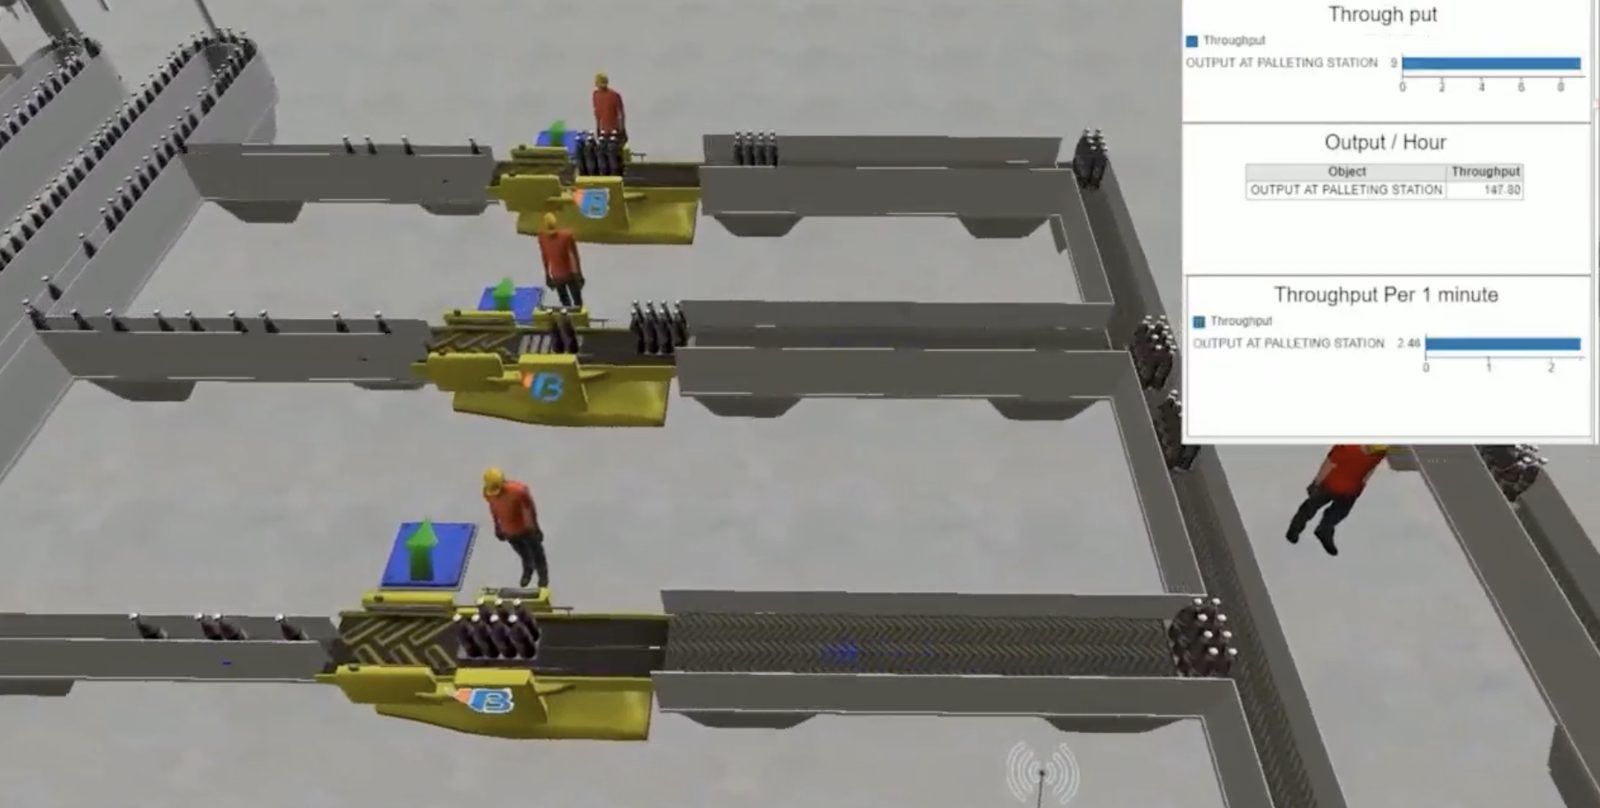
A pharma plant capacity model is a computer model of one line or one block, built from the batch records, the machine speeds, the changeover matrix and the shift pattern, that runs a year of production in minutes and reports what the plant can actually make, which station limits it and what each option does to the number. It is a discrete event simulation (a model that moves every batch, pallet and operator through time), built in FlexSim, and it answers the capacity question with a figure instead of an opinion.
The same model serves an API plant capacity simulation (reactors, dryers and mills as a batch train, in kilograms a month) and a pharma packaging line simulation (blister, bottle and carton stations, in strips or packs a shift). The question arrives in three forms: a new line or block has to be sized before the capex is approved, an investor or lender wants the capacity case checked before the money is released, or a running line is short of its nameplate and nobody agrees why. The model answers all three with the same numbers: strips, vials or kilograms per shift, station load, batches lost to changeover and cleaning, and the output of each option on the table.
Capacity terms, in plain words
| Term | What it means | What the model does with it |
|---|---|---|
| Nameplate capacity | What the machine vendors' speeds add up to if nothing ever waits | The ceiling the model starts from; the gap to it is the finding |
| Bottleneck | The one station whose pace sets the output of the whole line | Found by station load; it moves when you fix it, so the model is re-run |
| OEE | Availability times performance times quality on one machine | Taken from the line's own records and used as the machine's real speed, not the catalogue speed |
| Changeover and line clearance | The time a line stands still between products, including cleaning and QA release | Modelled per product pair from the matrix; usually the largest hidden loss |
| Campaign | Batches of one product run back to back to avoid changeovers | Campaign length is a scenario the model tests against stock cover |
| Batch cycle time | Granulation to packed stock for one batch, with every hold and QC release | Built from the BMR and the QC lead times; drives the WIP and warehouse figures |
| Line balancing | Setting station speeds and buffers so no station starves or blocks another | Options are balanced in the model before any equipment is ordered |
| Scenario | One set of changes to the line, run as a year of production | Each option in the report is one scenario with its output, load and payback |
Want the real capacity of your line, not the nameplate? The one-page capacity check comes back from one month of output.
What inputs does a capacity model need from a pharma plant?
Seven inputs, all of which the plant already holds: the batch manufacturing records for the products that carry the volume, machine speeds and OEE from the line logs, the changeover and cleaning matrix with QA release times, the shift pattern and planned maintenance, the product mix and campaign rules, the warehouse and dispensing capacity, and the QC lead times that hold a batch before it moves. Nothing is measured that the plant has not already written down; where a figure is missing, VB counts it on the floor.
| Input | Where it comes from | What it decides in the model |
|---|---|---|
| Batch records (BMR) | Stage times for the volume products | Batch cycle time and the load on each stage |
| Machine speed and OEE | Line logs, MES or shift reports | The real pace of each station, not the catalogue pace |
| Changeover matrix | Product-to-product changeover, cleaning, line clearance, QA release | The time lost to the product mix and campaign rules |
| Shift pattern | Shifts, breaks, planned maintenance, holidays | The hours the line is available in a year |
| Product mix | Sales plan or the investor case | What the line is asked to make, and in what campaigns |
| Warehouse and dispensing | Pallet positions, dispensing booths, forklifts | Whether materials reach the line when it needs them |
| QC lead times | Release times per test and per stage | Batches waiting, WIP and the stock the warehouse must hold |
The model is validated against last year's actual output before any option is run: if it cannot reproduce what the line did, it is not trusted with what the line could do. That validation figure is in the report.
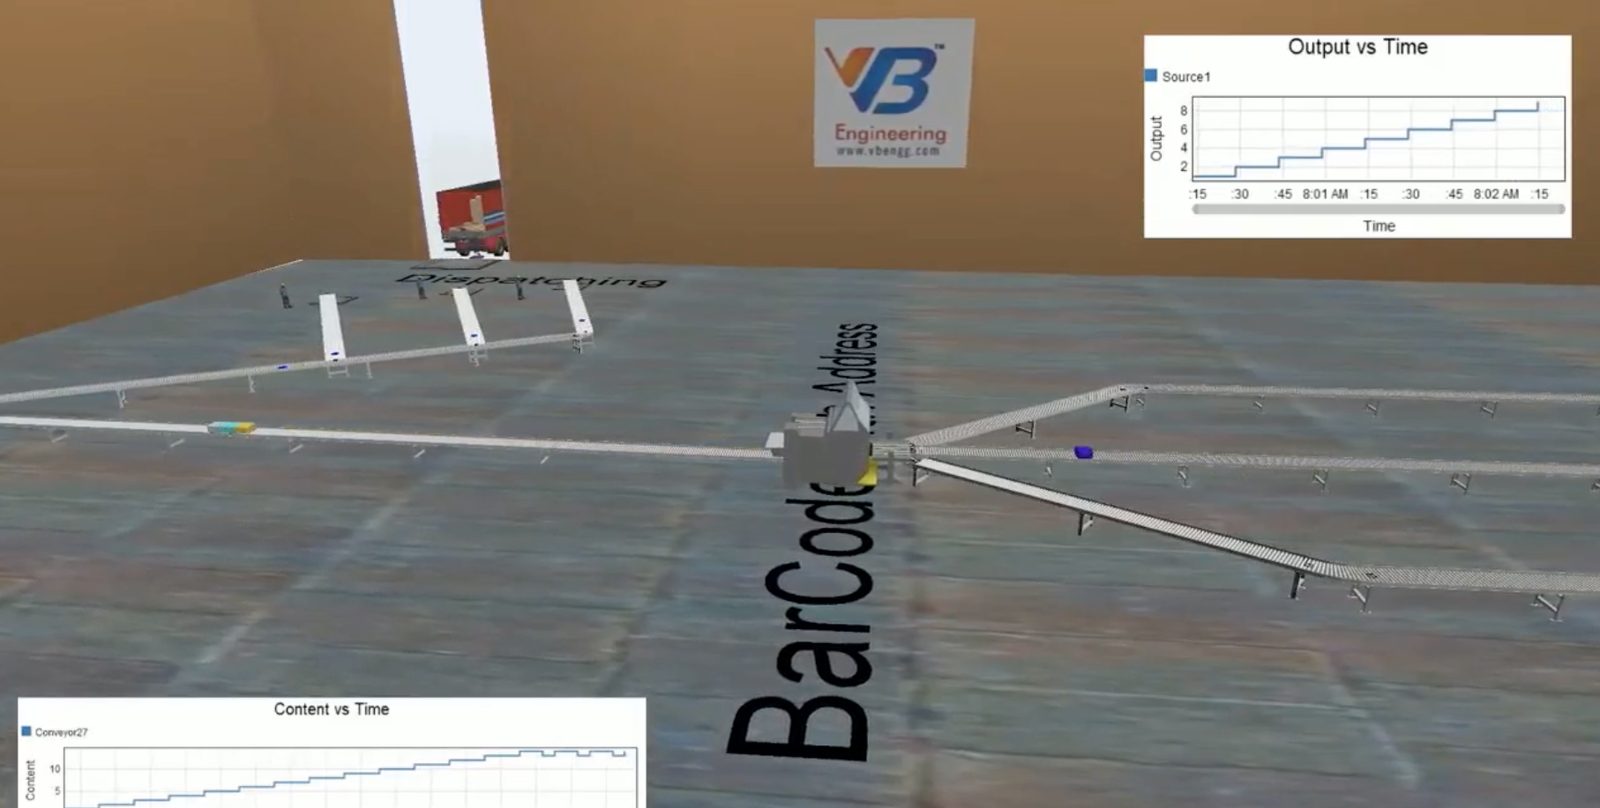
Every input on this list already sits in your plant. Send the data pack and the model starts this week.
When does a pharma plant need a capacity model?
The order comes when a number has to be defended: a new line is on the capex list, an investor or lender has asked how the capacity in the pitch was arrived at, or a line is making less than its nameplate and the vendors, production and QA each have a different reason.
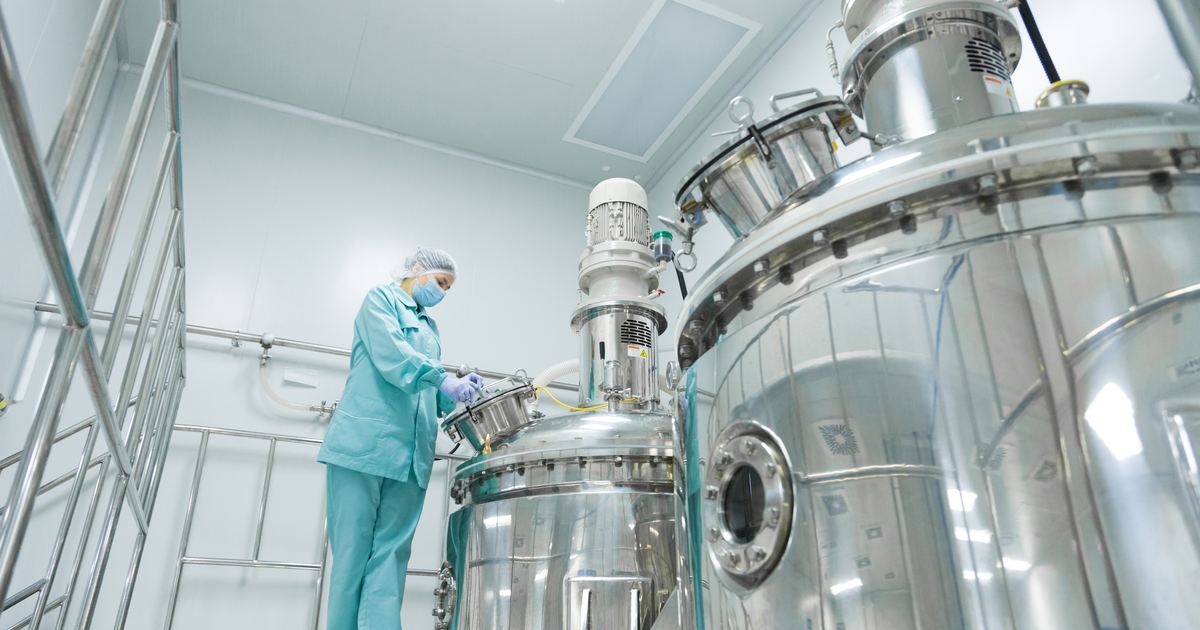
New line, investor case or a line short of nameplate: price the study for your situation.
How does a capacity model compare the options for a pharma line?
Every option is run as a full year of production against the same product mix and shift pattern, and reported on the same four numbers: output per shift, the station that limits it, the hours lost to changeover and cleaning, and the payback of the change. The table below is one OSD line with a coater bottleneck, modelled as an illustration; the figures for your line come from your records.
| Scenario | Output per shift | Limiting station | Changeover hours a month | What it costs |
|---|---|---|---|---|
| Today | 62,000 strips | Coater, 100% load | 58 | Nothing; the line stays short of the sales plan |
| Option A · campaign rules and faster line clearance | 71,000 strips | Coater, 100% | 36 | Procedure change; no capex |
| Option B · second coater and a buffer before blistering | 94,000 strips | Blister, 85% | 36 | One coater, one buffer station; payback inside the plan year |
| Option C · new line | 124,000 strips | None under 80% | 36 | A full line and the block to put it in; needed only if the sales plan passes Option B |
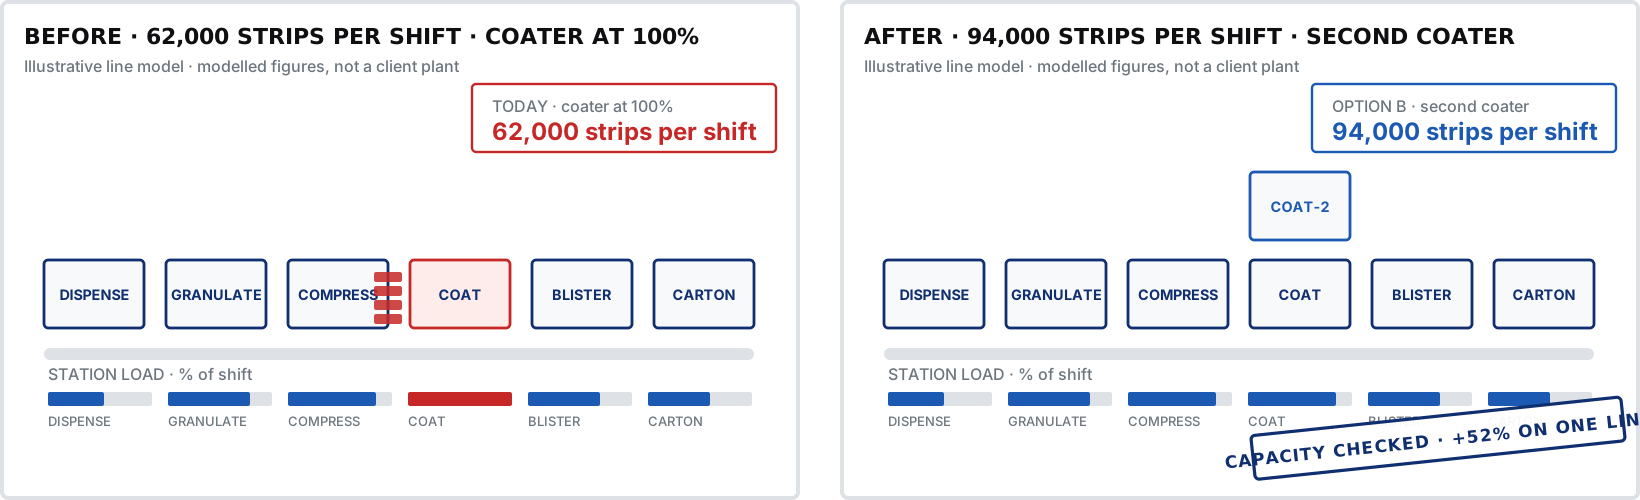
The board sees that the investor case needs Option B and not Option C; the projects head sees that one coater and one buffer station, not a new block, close the gap this year. That page is what the model is for.
Get the option table for your own line: output, limiting station, changeover hours and payback per option.
Which rules shape a capacity decision in a pharma plant?
No rule requires a capacity model, and every rule that governs the premises and the process shapes what the model is allowed to propose: a second machine needs a room with the right grade and flow, a new product needs its own cleaning validation, and a new block needs the Schedule M premises and a licence amendment.
| Rule | What it does to the options |
|---|---|
| Revised Schedule M (G.S.R. 922(E), Dec 2023) | Premises, one-way flow, segregation and dedicated facilities. A second machine or a new line only counts if there is a compliant room for it; the model and the layout are checked together on the pharmaceutical plant layout design page. |
| Cleaning validation and changeover (Schedule M, WHO GMP) | Sets the minimum changeover and line-clearance times between products. The model never uses a changeover shorter than the validated procedure. |
| Licence and plan approval (state FDA, Factories Act) | A new line or block is a licence amendment and a plan extension. The option that avoids it is scored for that; the option that needs it carries the time. |
| Your client and parent standards | USFDA, EU GMP Annex 1 and a parent or CDMO client's own capacity and campaign rules. They are inputs to the model, not footnotes. |
The premises rules for the room the new machine goes in are on the pharmaceutical plant layout design page; the two studies run together when a line is added.
What does a pharma capacity study include?
Whether it is a simulation study for a new pharma plant or a model of a line that is running, the study starts with the line as it runs today, modelled and validated against last year's output, and ends with the option table and the report the board, the lender and the projects head each take their page from.
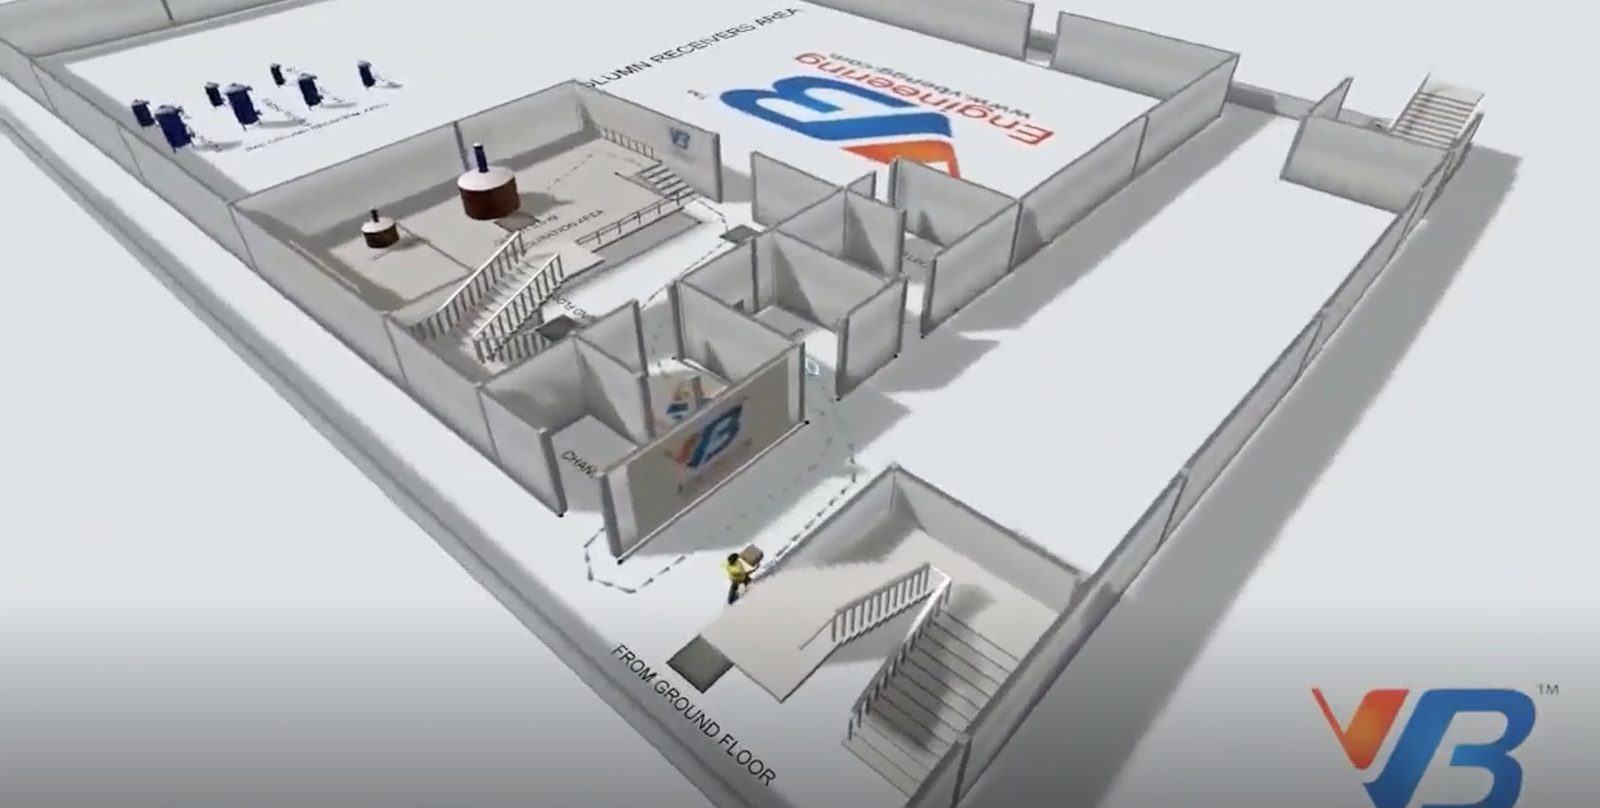
- Data pack from your records: BMR stage times, machine speeds and OEE, changeover and cleaning matrix, shift pattern, product mix, QC lead times
- Line or block model in FlexSim, with warehouse, dispensing and QC release where they limit the line
- Validation run against last year's actual output, with the fit reported
- Three to five scenarios, each run as a year of production: output per shift, limiting station, changeover hours, WIP and payback
- Option table and recommendation, with the campaign rule or the equipment list that goes with it
- Capacity report for the capex paper or the investor case, plus the model file and a walkthrough with your team
Send one month of line output and the changeover matrix: the one-page capacity check comes back with the nameplate, the real output and the gap between them.
How is a pharma capacity study priced in India?
Three things set the price: how many lines or batch trains are modelled, whether the line data exists in your records or has to be counted on the floor, and how many scenarios the decision needs. A single line on your own records is the smallest study; a block with warehouse, dispensing and QC is the largest.
| Part of the work | How it is priced | What moves the price |
|---|---|---|
| Line model on your records | Lines and products in the model | Products in the mix, scenarios, report for a capex paper or an investor case |
| Line model with a time study on site | Lines plus field days | Stations to time, shifts to observe, changeovers to witness |
| Block or plant model | Lines, warehouse, dispensing and QC in one model | Blocks and lines, products, campaign rules, planning horizon |
Get a price estimate
Three questions about your plant. A simulation engineer compares them with pharma capacity studies already delivered and sends the estimate.
Nothing is quoted by a calculator. A simulation engineer reads your answers; if you want proof first, the one-page capacity check of your current line comes before the estimate.
How does VB build a capacity model of a pharma plant?
Four steps, each with something you can hold: the data pack is assembled from your records and the gaps counted on the floor, the model is built and validated against last year, the options are run as a year of production each, and the report is walked through with production, QA and the projects head before it goes to the board.
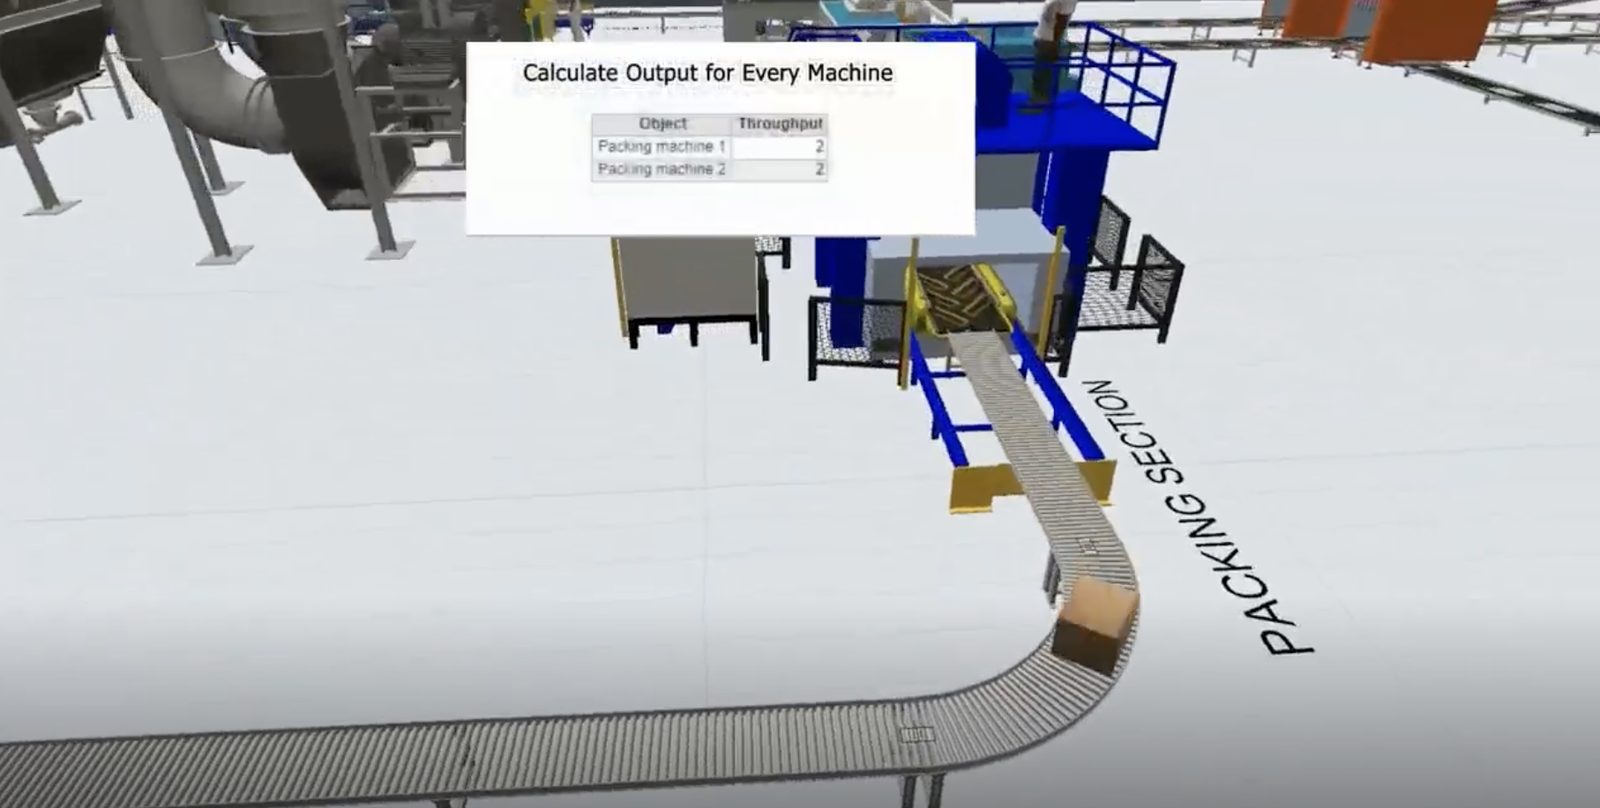
Data pack
BMR stage times, speeds and OEE from the line logs, the changeover and cleaning matrix, shifts, mix and QC lead times collected; missing figures timed on the floor.Model and validate
Line or block built in FlexSim; a year of last year's mix run and the output compared with what the plant actually made. The fit is reported before any option is run.Scenarios
Three to five options run as a year each: campaign rules, a second machine, a buffer, a shift, a new line, a new block. Output, limiting station, changeover hours and payback on one table.Report and walkthrough
Capacity report for the capex paper or the investor case, the model file, and a walkthrough with production, QA and projects so every figure has an owner before the board sees it.A capacity figure built from vendor speeds is a figure for a plant with no changeovers, no cleaning and no QC. The gap between nameplate and real output in OSD and API plants is set by changeover, line clearance and release times, not by machine speed. VB builds those into the model from your records, and validates the model against last year before any option is run.
Five weeks from data pack to board paper. Book the data-pack week now.
Which software does VB use to build a pharma capacity model?
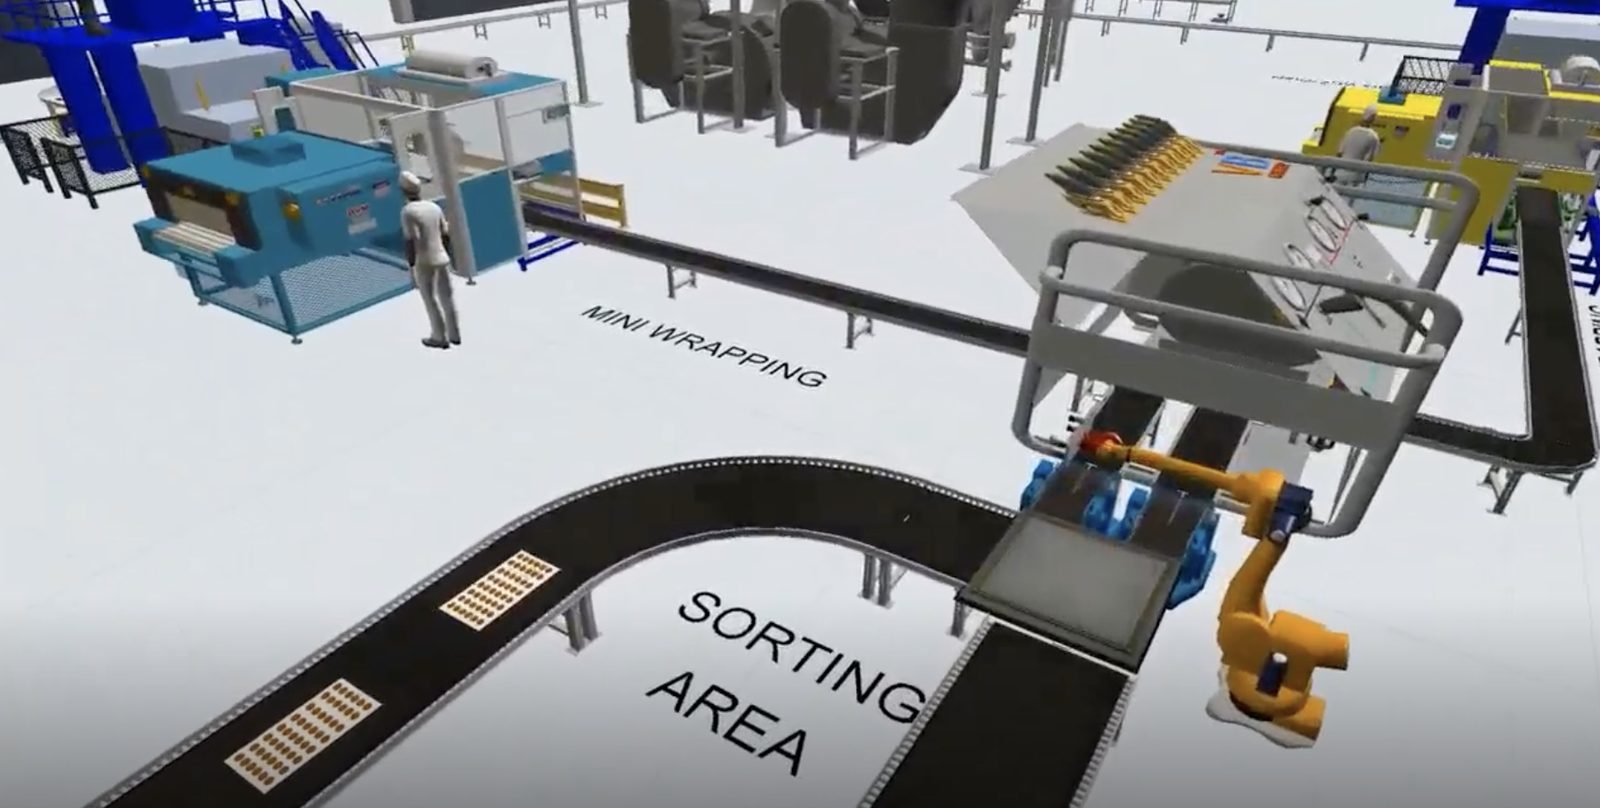
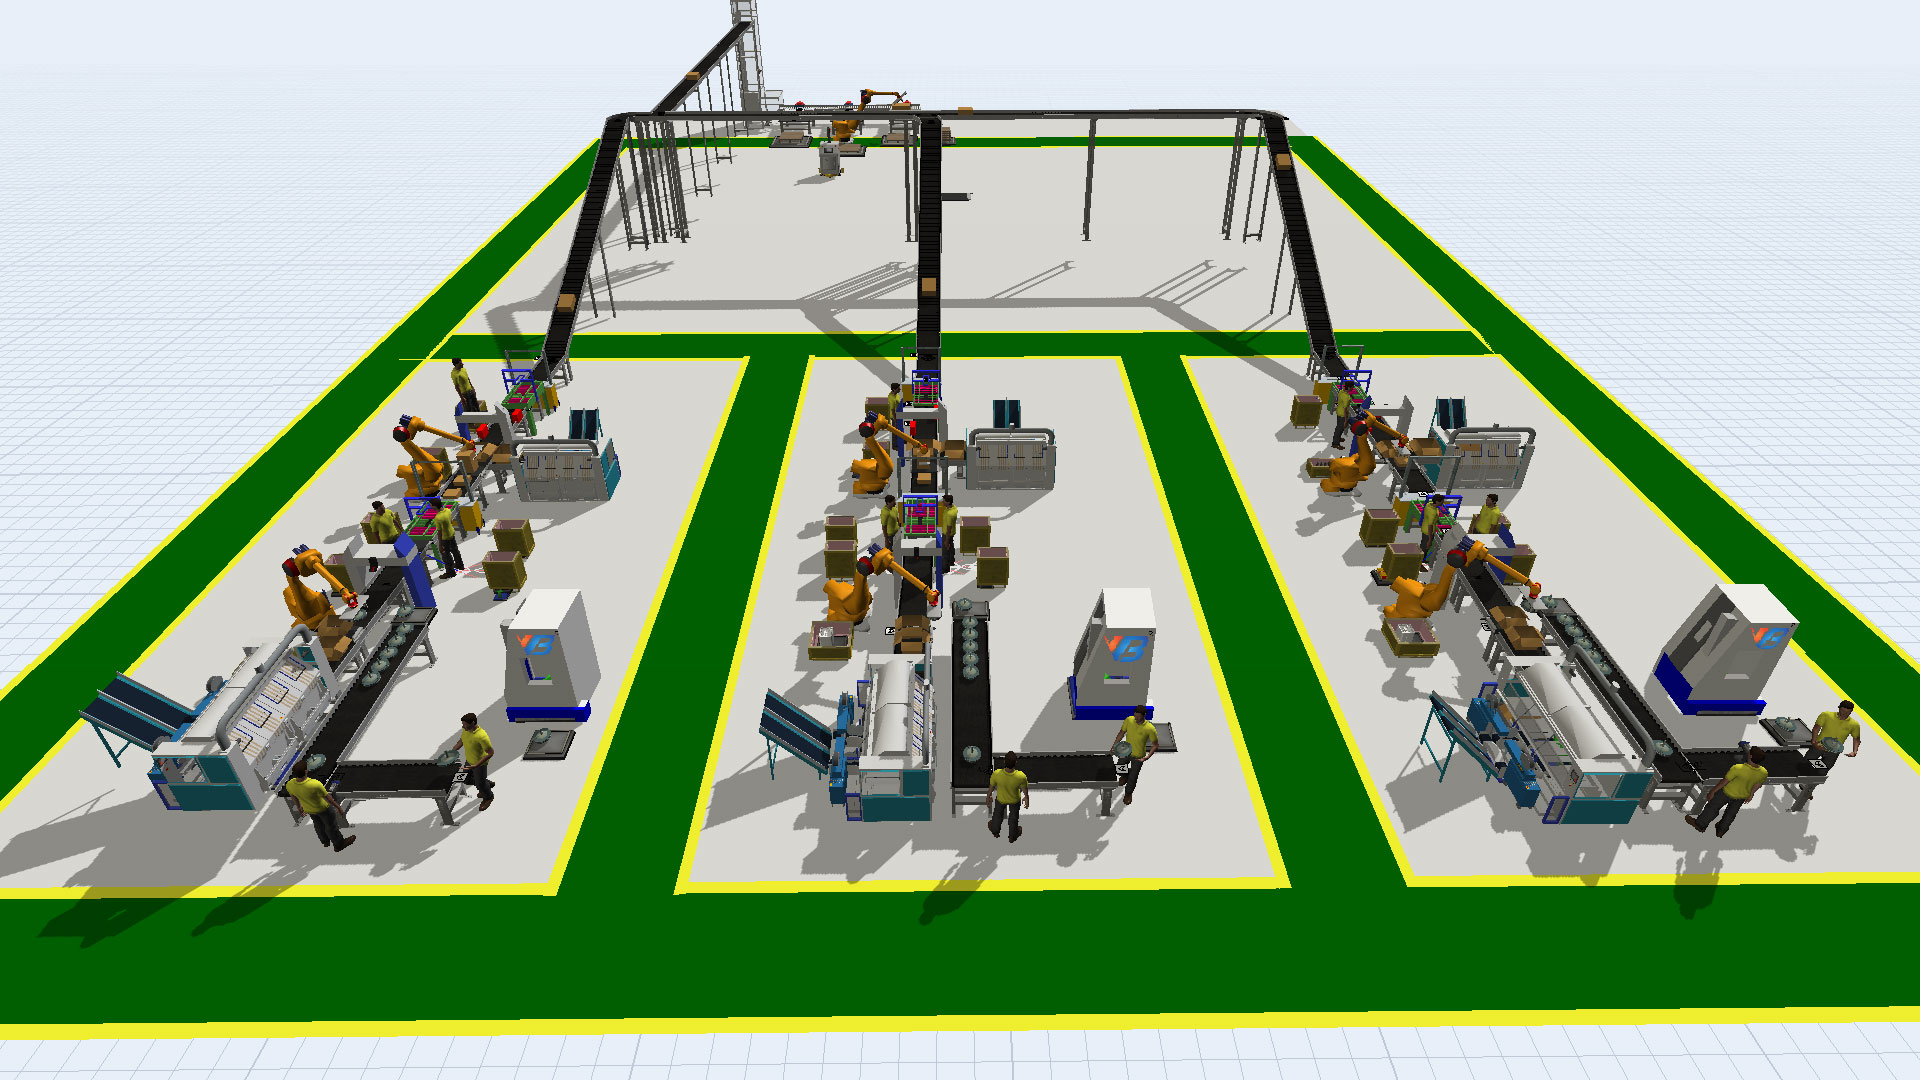
VB builds line and plant capacity models in FlexSim, the discrete event simulation platform now part of Autodesk, and hands the model file over with the report so your team can re-run scenarios after the study. Where an option needs a room, the layout is drawn in AutoCAD on the plant's base plan. VB's simulation teams also work in AnyLogic, Simio and Siemens Plant Simulation where a client or parent standard specifies them.
| Stage | Tools we work in | What you receive |
|---|---|---|
| Data pack | Your BMRs, line logs, MES or OEE exports, changeover matrix, shift calendar · stopwatch time study on site where a figure is missing | One data pack with every input and its source, signed off by production and QA |
| Model and validate | FlexSim line or block model · validation run against last year's actual output | The model, its validation fit and the assumptions register |
| Scenarios | FlexSim experimenter, three to five options, each run as a year of production | Option table: output per shift, limiting station, changeover hours, WIP, payback |
| Layout where needed | AutoCAD on the measured or scanned base plan | The second machine, buffer or line placed on the one-way flow, in DWG and PDF |
| Report and handover | Capacity report, FlexSim model file, scenario dashboards, walkthrough | A board paper, an investor annex and a model your engineers can keep running |
Running a different platform? Tell us which one in the form. We deliver in the software and drawing standard your plant already uses.
Product names are trademarks of their respective owners.
What does a pharma capacity study deliver, start to finish?
A mid-size oral solid dosage plant in western India had a second blister line on the capex list and an investor asking how the 90,000-strips-per-shift figure in the pitch had been arrived at. The brief from the promoter: prove the number or replace it, in five weeks.
The model showed the coater at 100% load with four pallets of cores waiting in front of it every shift, and 58 hours a month lost to changeover and line clearance. The second blister line in the capex paper would have run at 55%. Option B, a second coater and a buffer before blistering, with the campaign rule from Option A, took the line to 94,000 strips per shift at a fraction of the capex, and the investor case was re-issued with the model validation attached. Representative project; the plant is not named.
Proof before commitment: a one-page capacity check of your current line.
Who builds, checks and signs your capacity model?
Three names go on every proposal, with CVs: the simulation engineer who builds and validates the model, the pharma process engineer who checks every input against the records, and the approver who signs the report. That is what a pharma plant capacity planning consultant should be able to show before the first invoice.
Simulation lead
CV shared with the proposalPharma process engineer
CV shared with the proposalVB Engineering approver
CV shared with the proposalPharma plant capacity: the questions projects heads and promoters ask
Should we simulate a new pharma line before approving the capex?
Yes, when the line costs more than the study by a wide margin, which is every line. The model turns vendor speeds into strips per shift with your product mix, changeovers and shifts, and often shows that a second machine or a campaign rule meets the plan without the line. In the modelled example on this page a coater and a buffer replaced a second blister line.
What does an investor want to see in a capacity plan for a pharma plant?
How the number was arrived at, station by station, and whether the model that produced it reproduces what the plant made last year. A capacity figure with its validation attached survives due diligence; a figure from vendor speeds does not. The report is written for that reader as well as for the projects head.
Can simulation tell us the real capacity of an existing pharma plant?
Yes, and that is the first run. The model is built from the plant's own records and validated against last year's output before any option is tried; the fit is reported. Real capacity is then the output of the validated model under the current mix, and the gap to nameplate is broken into changeover, cleaning, QC release and the limiting station.
How do you debottleneck a pharma plant?
Pharma plant debottlenecking starts with a pharma production bottleneck analysis in the model: finding the station at full load, fixing it in the model, and watching where the bottleneck moves next, because it always moves. Options are run in order of payback: campaign rules and line clearance first, a buffer or a second machine next, a shift or a line last. The model stops you buying the machine that the next bottleneck makes useless.
How do you add a new line to a running pharma block without stopping production?
The capacity model sizes the line and the layout study finds the room for it on the one-way flow; the two run together. The build is then phased around production in the layout move plan, with utilities run before the equipment arrives. The method for the premises side is on the pharmaceutical plant layout design page.
What inputs does a simulation consultant need from a pharma plant?
Batch records for the volume products, machine speeds and OEE from the line logs, the changeover and cleaning matrix with QA release times, the shift pattern, the product mix or the investor case, warehouse and dispensing capacity, and QC lead times. All of it already exists in the plant; VB counts on the floor only what is missing.
How long does a pharma line simulation study take?
About five weeks for one line on your records: a week for the data pack, two for the model and its validation, one for the scenarios and one for the report and walkthrough. A block with warehouse, dispensing and QC takes longer; a time study on site adds field days. The proposal commits to a schedule for your plant.
How much does a pharma plant simulation study cost?
The number of lines or batch trains, whether the data exists or has to be timed on the floor, and the number of scenarios set the price. A single line on your own records costs least. The estimator on this page gets you a figure by email with a written proposal; there is no rate card on screen.
What does a pharma plant simulation report contain?
The data pack and its sources, the model and its validation fit against last year, each scenario run as a year of production with output per shift, limiting station, changeover hours, WIP and payback, the option table and recommendation, and the equipment list or campaign rule that goes with it. The model file is handed over with a walkthrough.
How do you improve OEE on a pharma packaging line?
Availability, performance and quality losses are read from the line logs and put into the line model one station at a time, so the model shows which loss actually limits output: a blister machine at 85% availability, a cartoner starved by the buffer in front of it, or a changeover matrix that costs 58 hours a month. A packaging line OEE pharma consultant who stops at the dashboard tells you the number; the model tells you which fix moves it and by how much. API and OSD plants differ here: an API batch train is limited by cycle time and cleaning, an OSD line by the slowest station and the changeover matrix, and the report reads in each plant's own units.
A question not answered here? A simulation engineer replies within one working day.
Where to go next
Get a price estimate for your pharma capacity study
Say what is being decided, how many lines or batch trains are involved and when the number is needed. A simulation engineer comes back with the estimate, the schedule and a written proposal.
- A one-page capacity check of your current line, if you want proof before committing
- Your line as it runs, modelled and validated against last year
- The estimate, schedule and written proposal for the full study
Prefer to write? connect@groupvb.com · or WhatsApp us from the chat button
VB Group® · Sustainability A Certainty.
Short form. Written proposal.
Your name, work email and company, what is being decided, the number of lines and the date the number is needed.